Improve your performance by analyzing your ride data with the new Ride Analysis Page.
Performance Analytics, our new set of ride analysis tools, was made available to all TrainerRoad users on May 9th, 2018. We’ve already covered how to use the Training Stress Chart and Personal Records Page.
Today, we’re going to dive into ways you can become a faster, smarter rider using the final major feature area of Performance Analysis: the Ride Analysis Page.
Using Your Ride Data to Become a Faster, Smarter Cyclist
Cyclists who have the goal of continual improvement often have a lot of questions for themselves after a ride. They ask things like:
- Did I push myself hard enough, or too much?
- Did I handle key aspects of my ride (corners, a breakaway, the wind, etc.) efficiently?
- Did I make any new power PRs?
- Could I have paced better?
The Ride Analysis Page is where you find the data to answer these kinds of questions, and more.
Let’s dig into some examples and how to find the answers to each of these questions.
Did I Push Myself Too Hard or Too Little?
This is an example of a rider who had two consecutive races and won both. Despite getting the win, their power data shows they could have used their energy more efficiently.
From the Power Zone chart on the Ride Analysis Page, the rider can see they spent 48% of their time at high intensity and only 25% of their time at low intensity; whereas in their Category 3/4/5 race (which had a lot more competition), the rider spent 33% of their time at high intensity and 43% of time at low intensity.
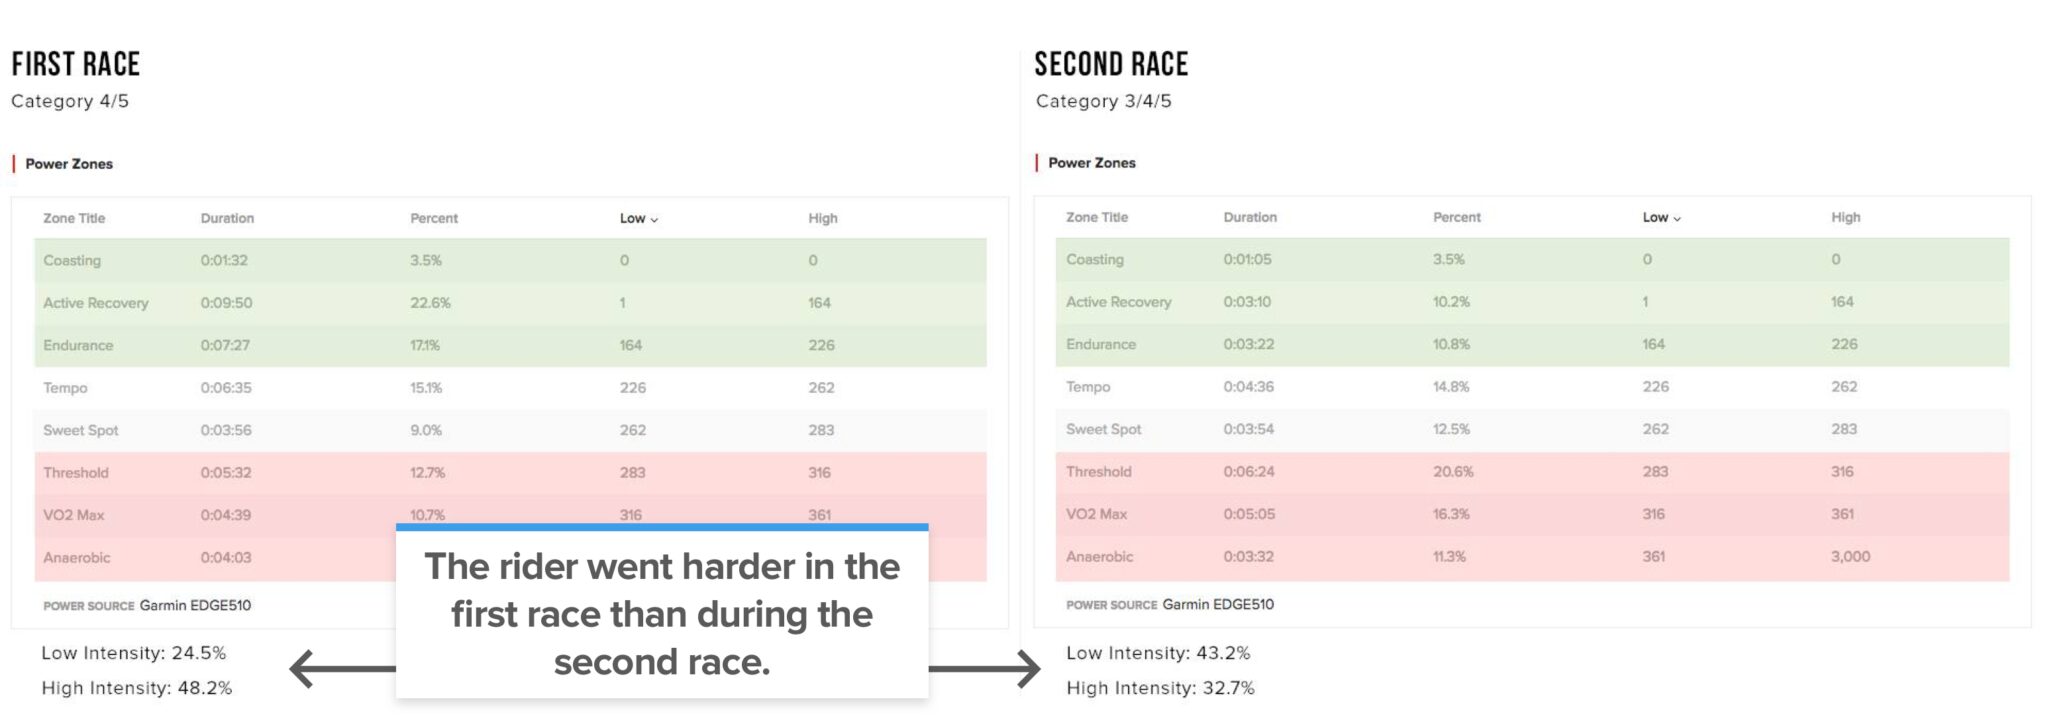
While winning was the objective, this data tells the athlete that they still have room for improvement. If the rider had a more difficult second race, they could have put themself in a tough spot by going too hard in the first race when they didn’t need to.
In a future race, rather than defaulting to simply riding as hard as they can, the rider will think about how they can adjust their riding to conserve energy and still achieve a win.
Did I Handle That Breakaway, Those Corners and That Wind Efficiently?
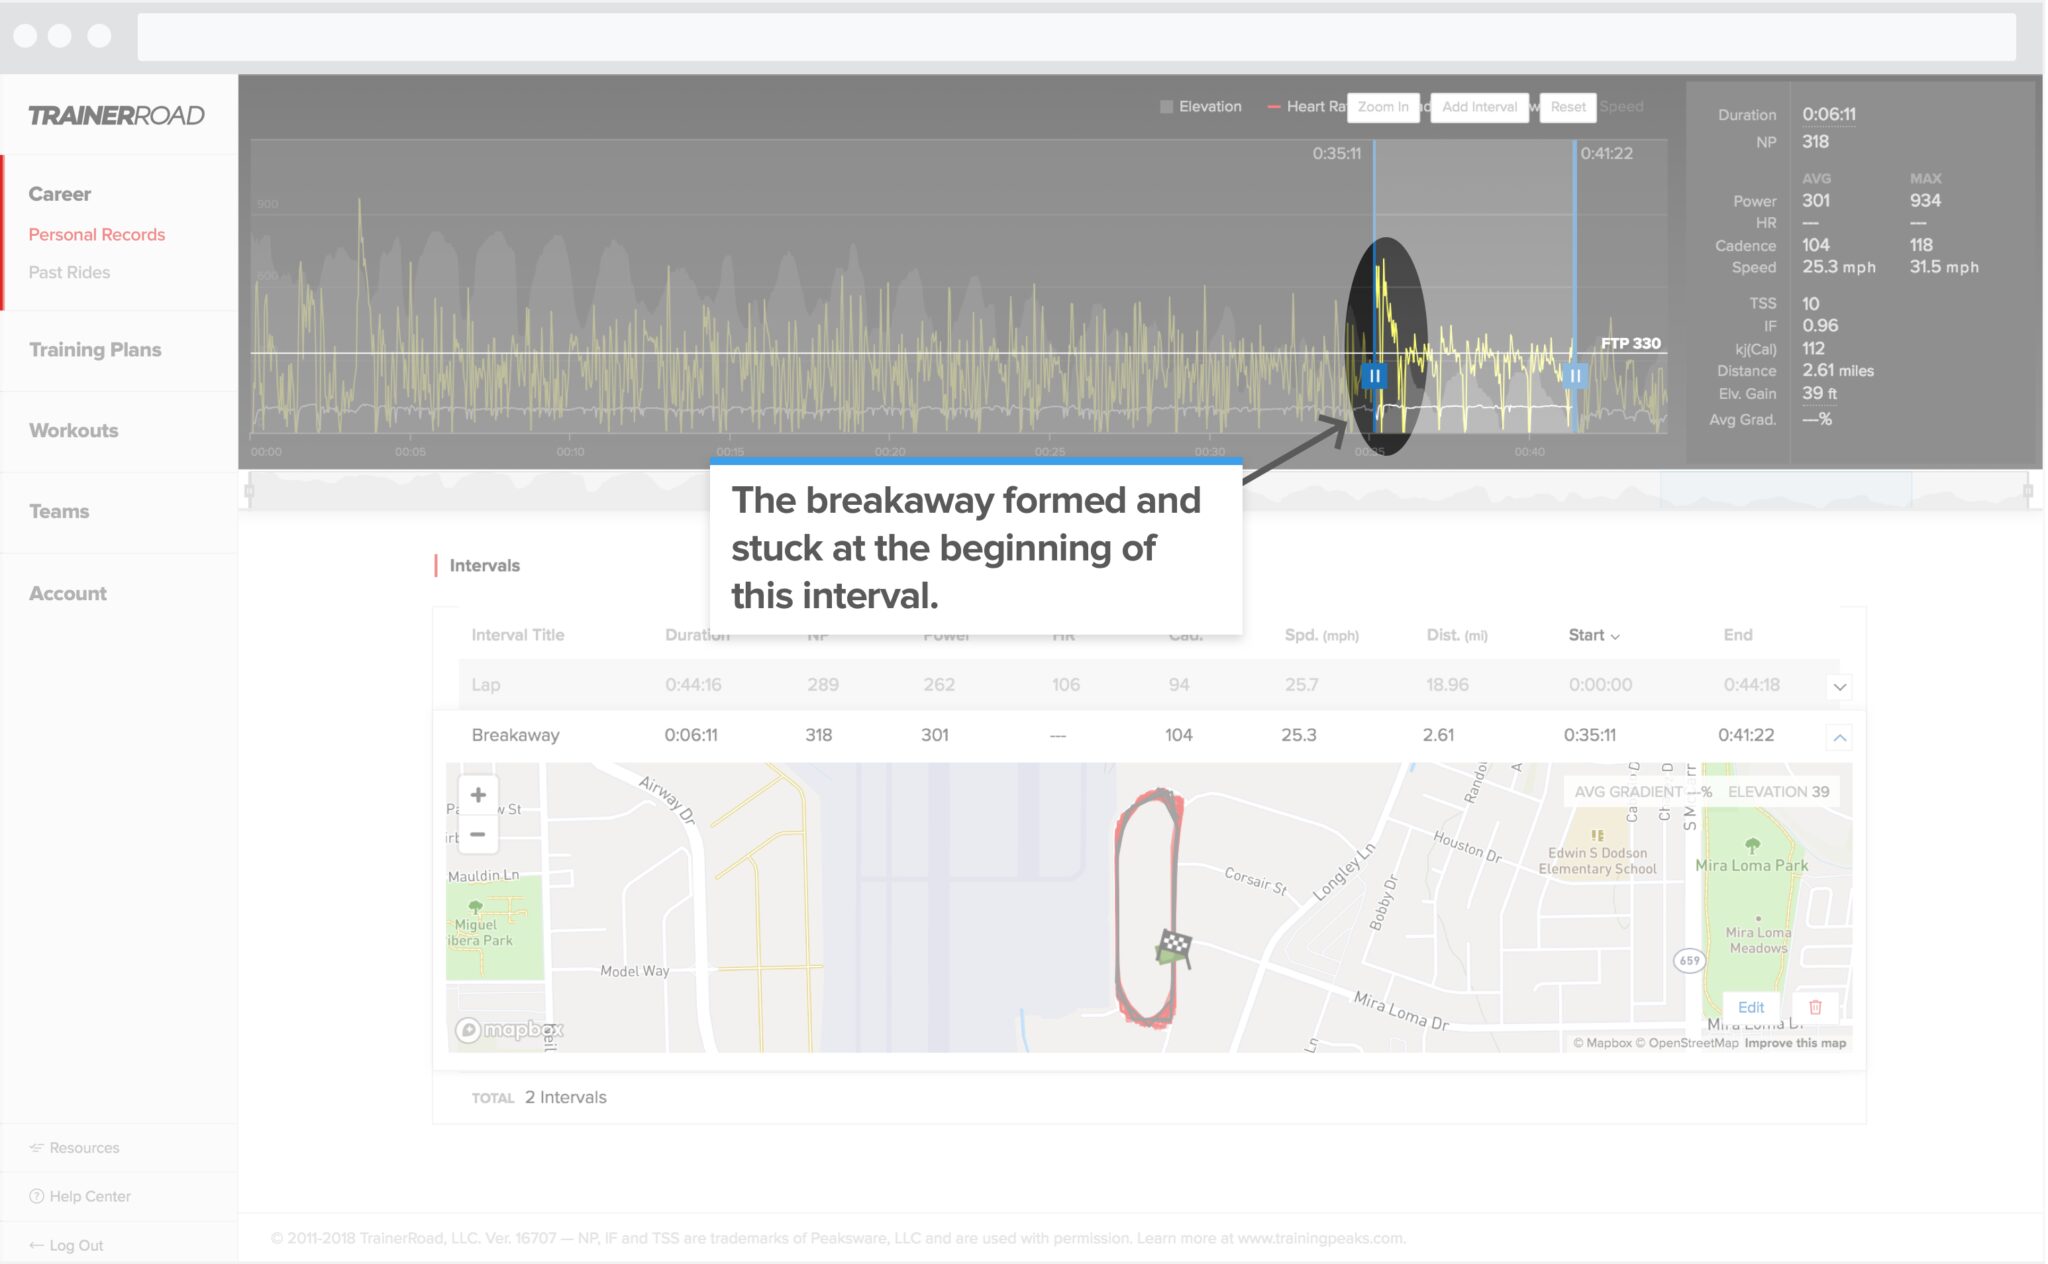
In this example the rider didn’t win, but helped stick a breakaway during a rather gusty race. Post race, they can analyze their breakaway and drill into what made the difference between winning and losing.
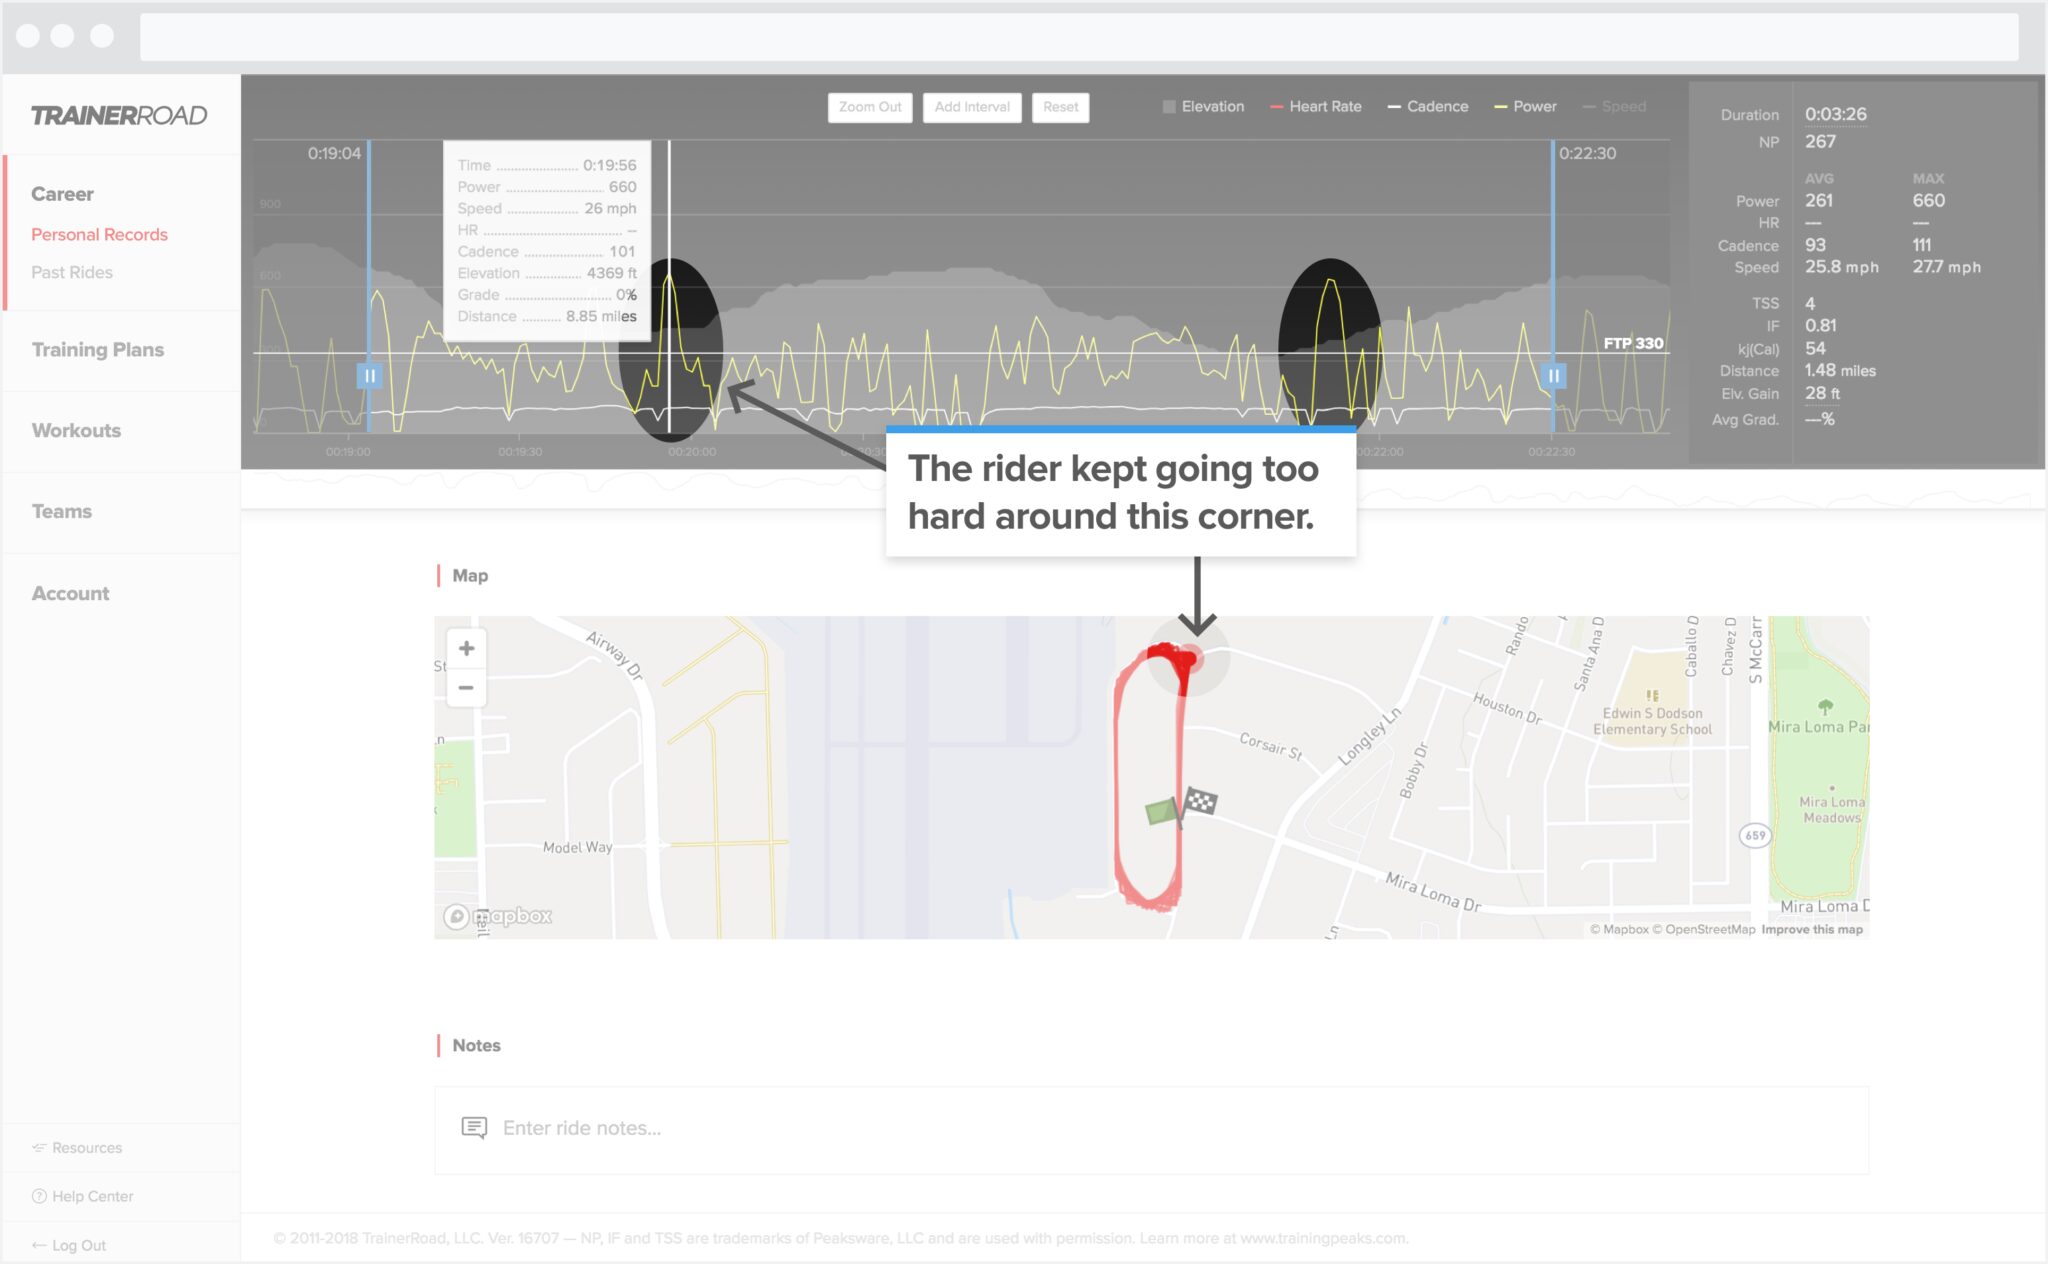
From the Ride Analysis Page, they can see they put out too much power every time they rounded the northeast corner. If they would’ve conserved energy going into the headwind section before/around that corner, they would’ve been able to go harder in the tailwind section where the course picks up more speed.
The rider fought the wind along the west side of the course before making the northeast corner where they hit the faster tailwind section.
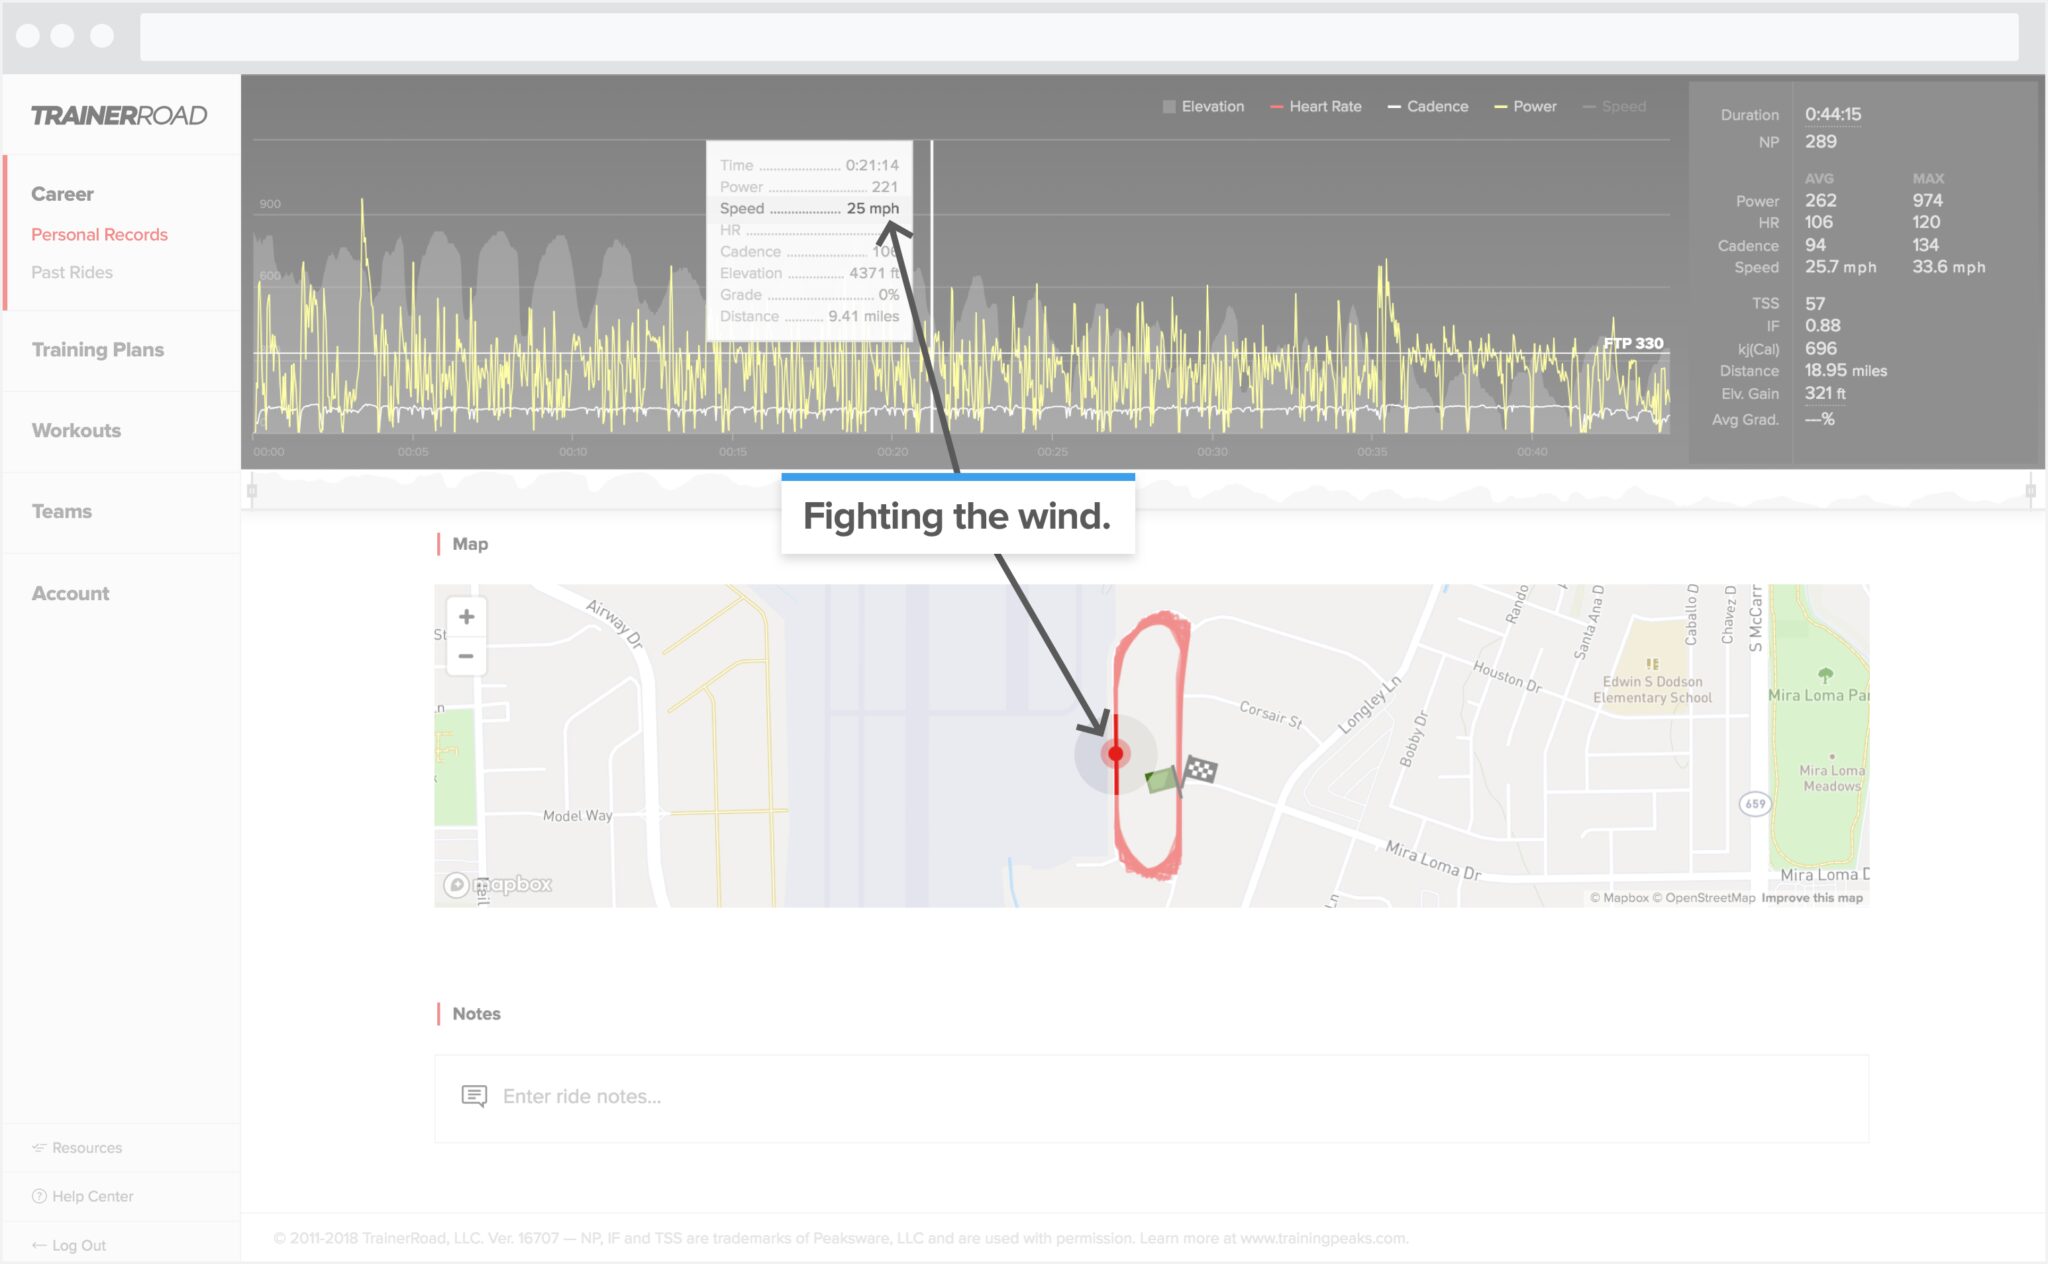
They average around 25 mph going into the wind then about 27-28 mph with the tailwind at their back. They also averaged a higher power output into the headwind than they did with the wind at their back.
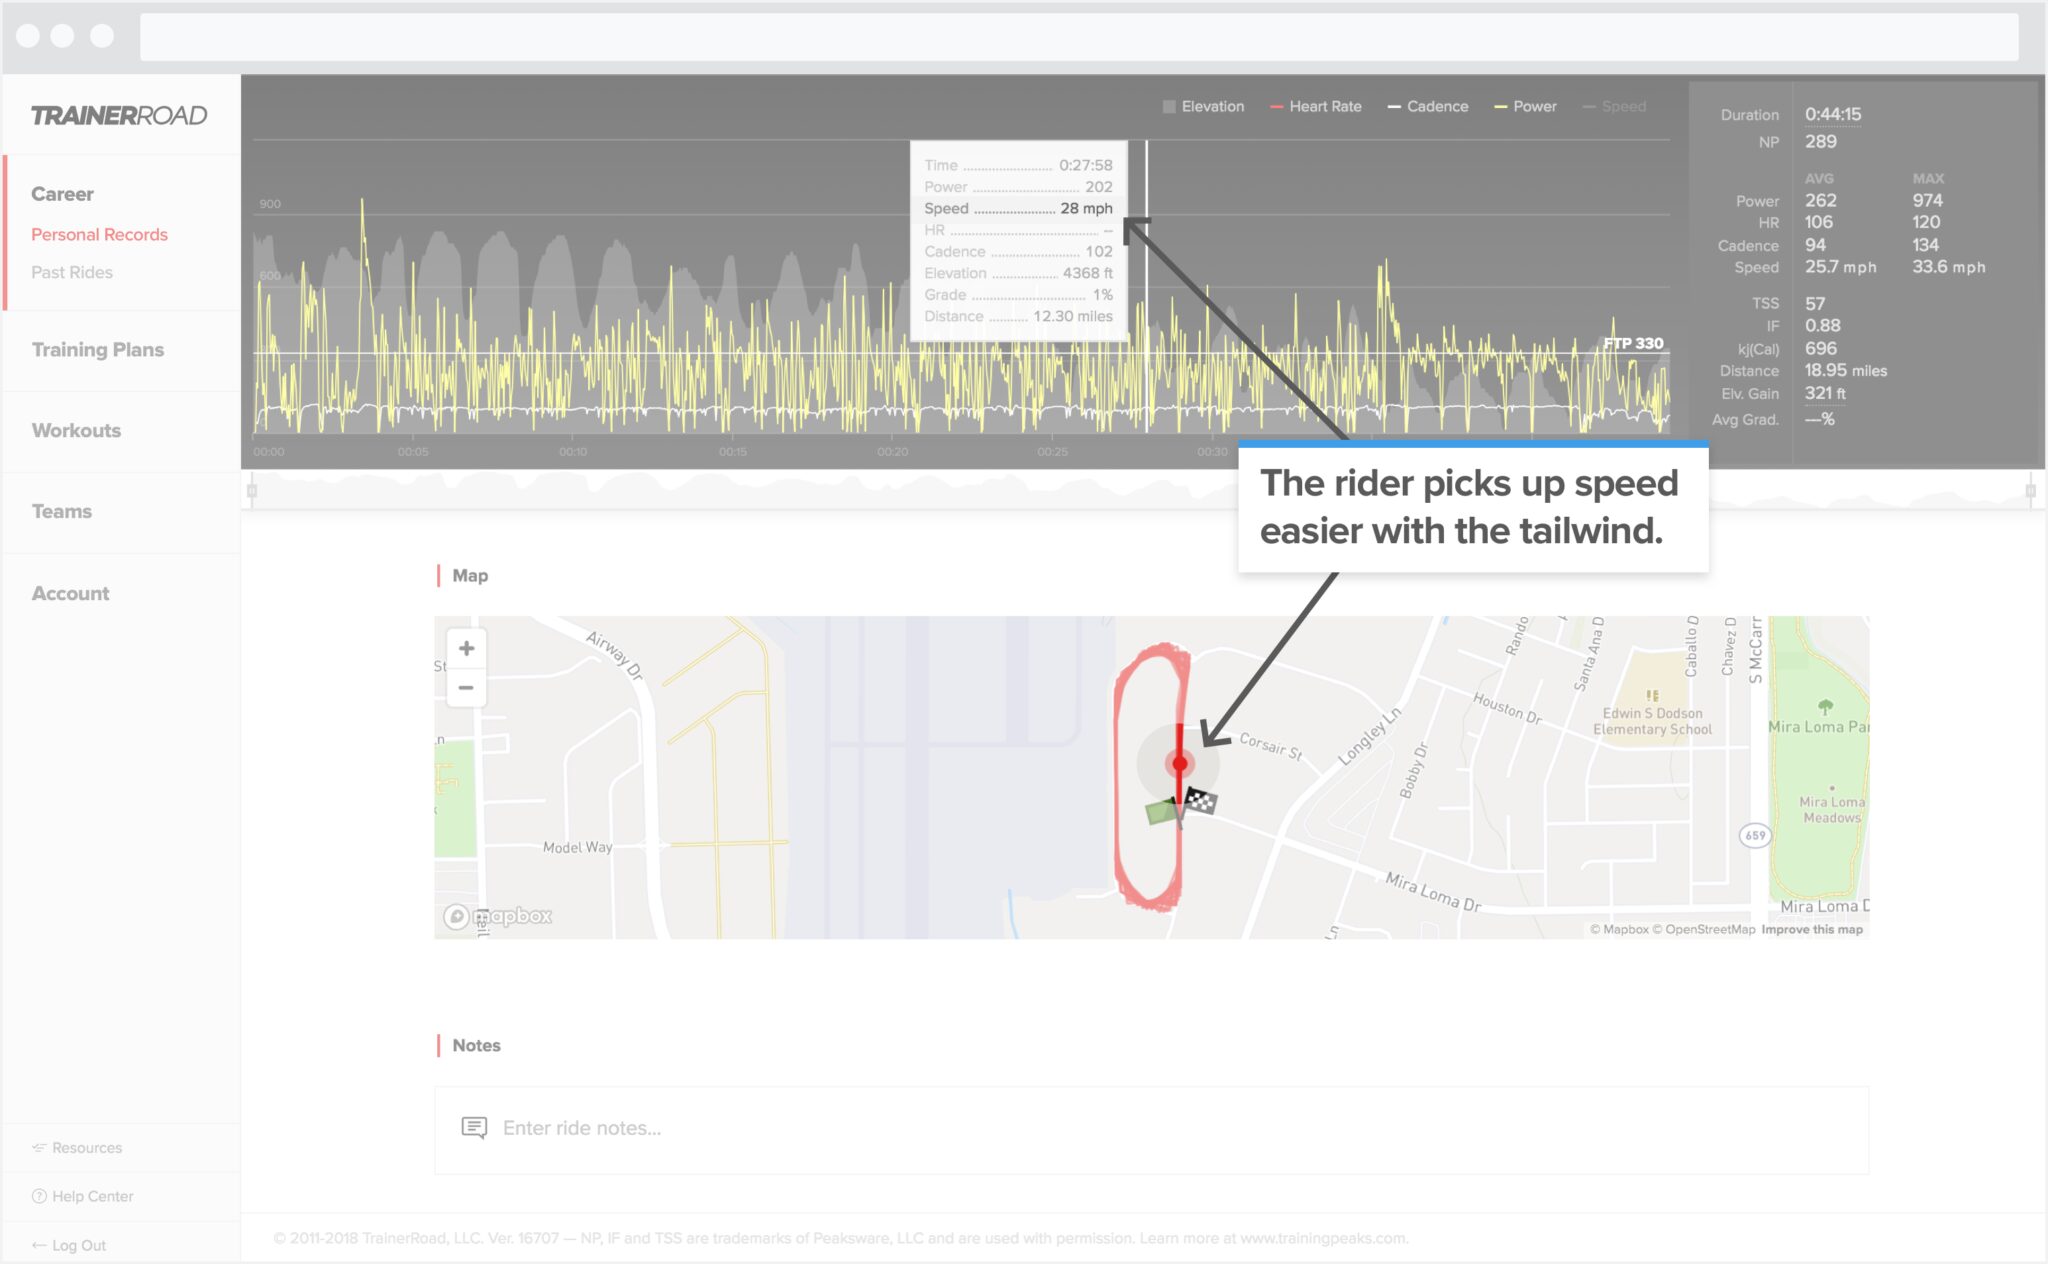
The rider could have gone harder during the tailwind section where it was easier to pick up speed if they hadn’t gone as hard as they did into the wind and around that northeast corner.
The fast section where they want the speed is along the stretch after the turn. They know for next time to not get so eager and conserve their energy for when they get to this section during the race.
Did I Make Any New Power PRs?
This is an example of a rider who had a breakthrough race, and now they can use the Personal Records Chart on the Ride Analysis Page to confirm just how much they really achieved.
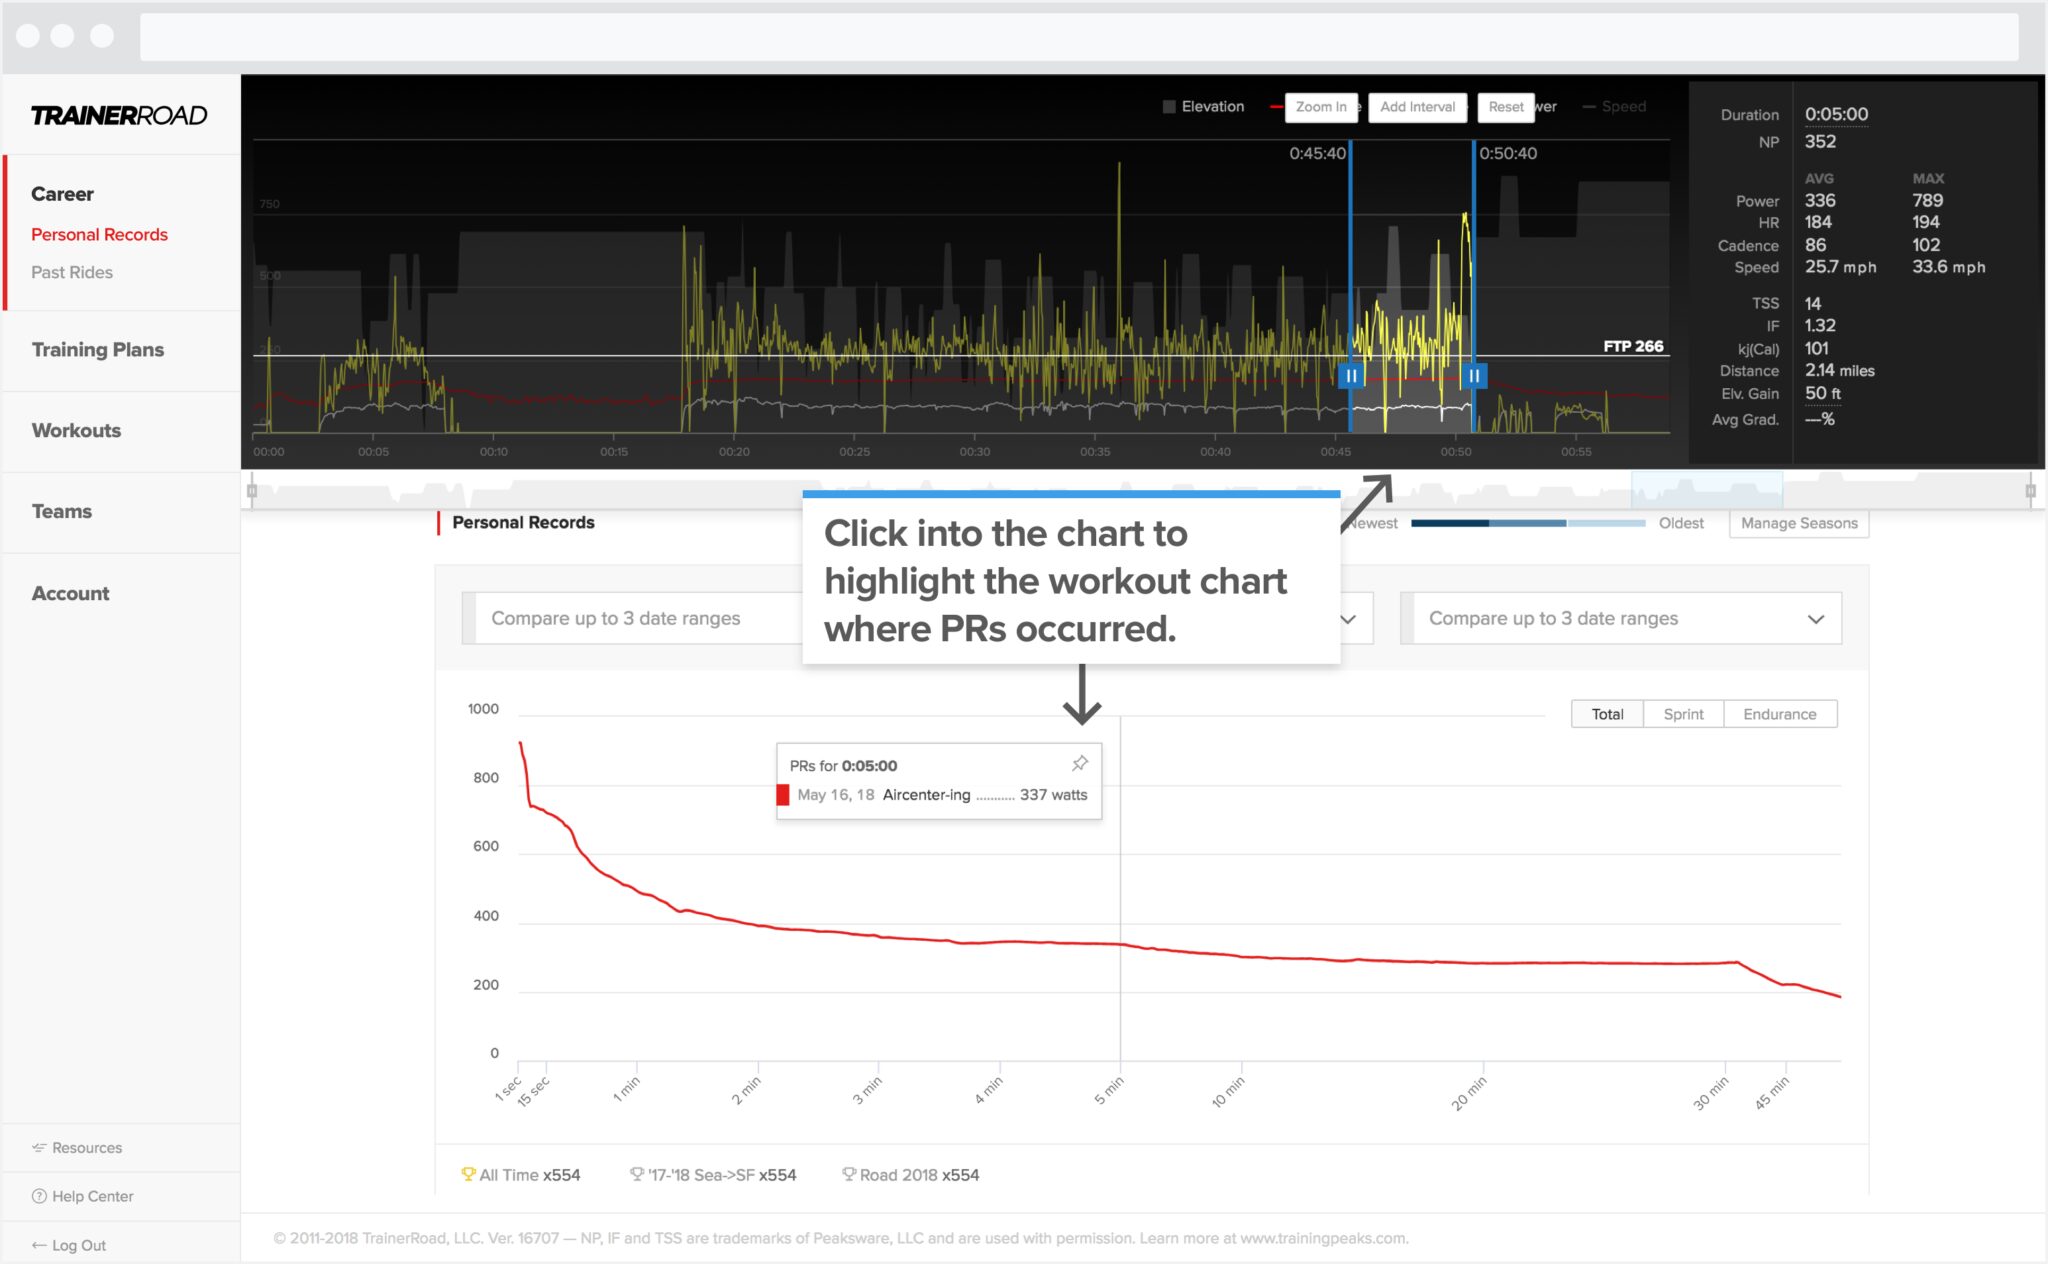
They earned 554 new power PRs as represented by trophies shown on their Personal Records Chart. To analyze each specific PR they achieved, the rider can scrub along the chart which interacts with the workout graph above.
For instance, during the final 5 minutes of their race, the rider was in a break. This is the exact point in their race they can see they made their new 5-minute PR. They were tucked in with the group as they made the final turn before the sprint, but then decided to sprint out of the group right after that turn.
The rider was out-sprinted in the final meters of the race and wonders if sprinting that early away from the group was the right move.
They can see their new 5-minute PR was achieved during this ride occurred in the final laps of the race.
The rider can also see the sprint started as soon as they rounded the northeast corner of the course.
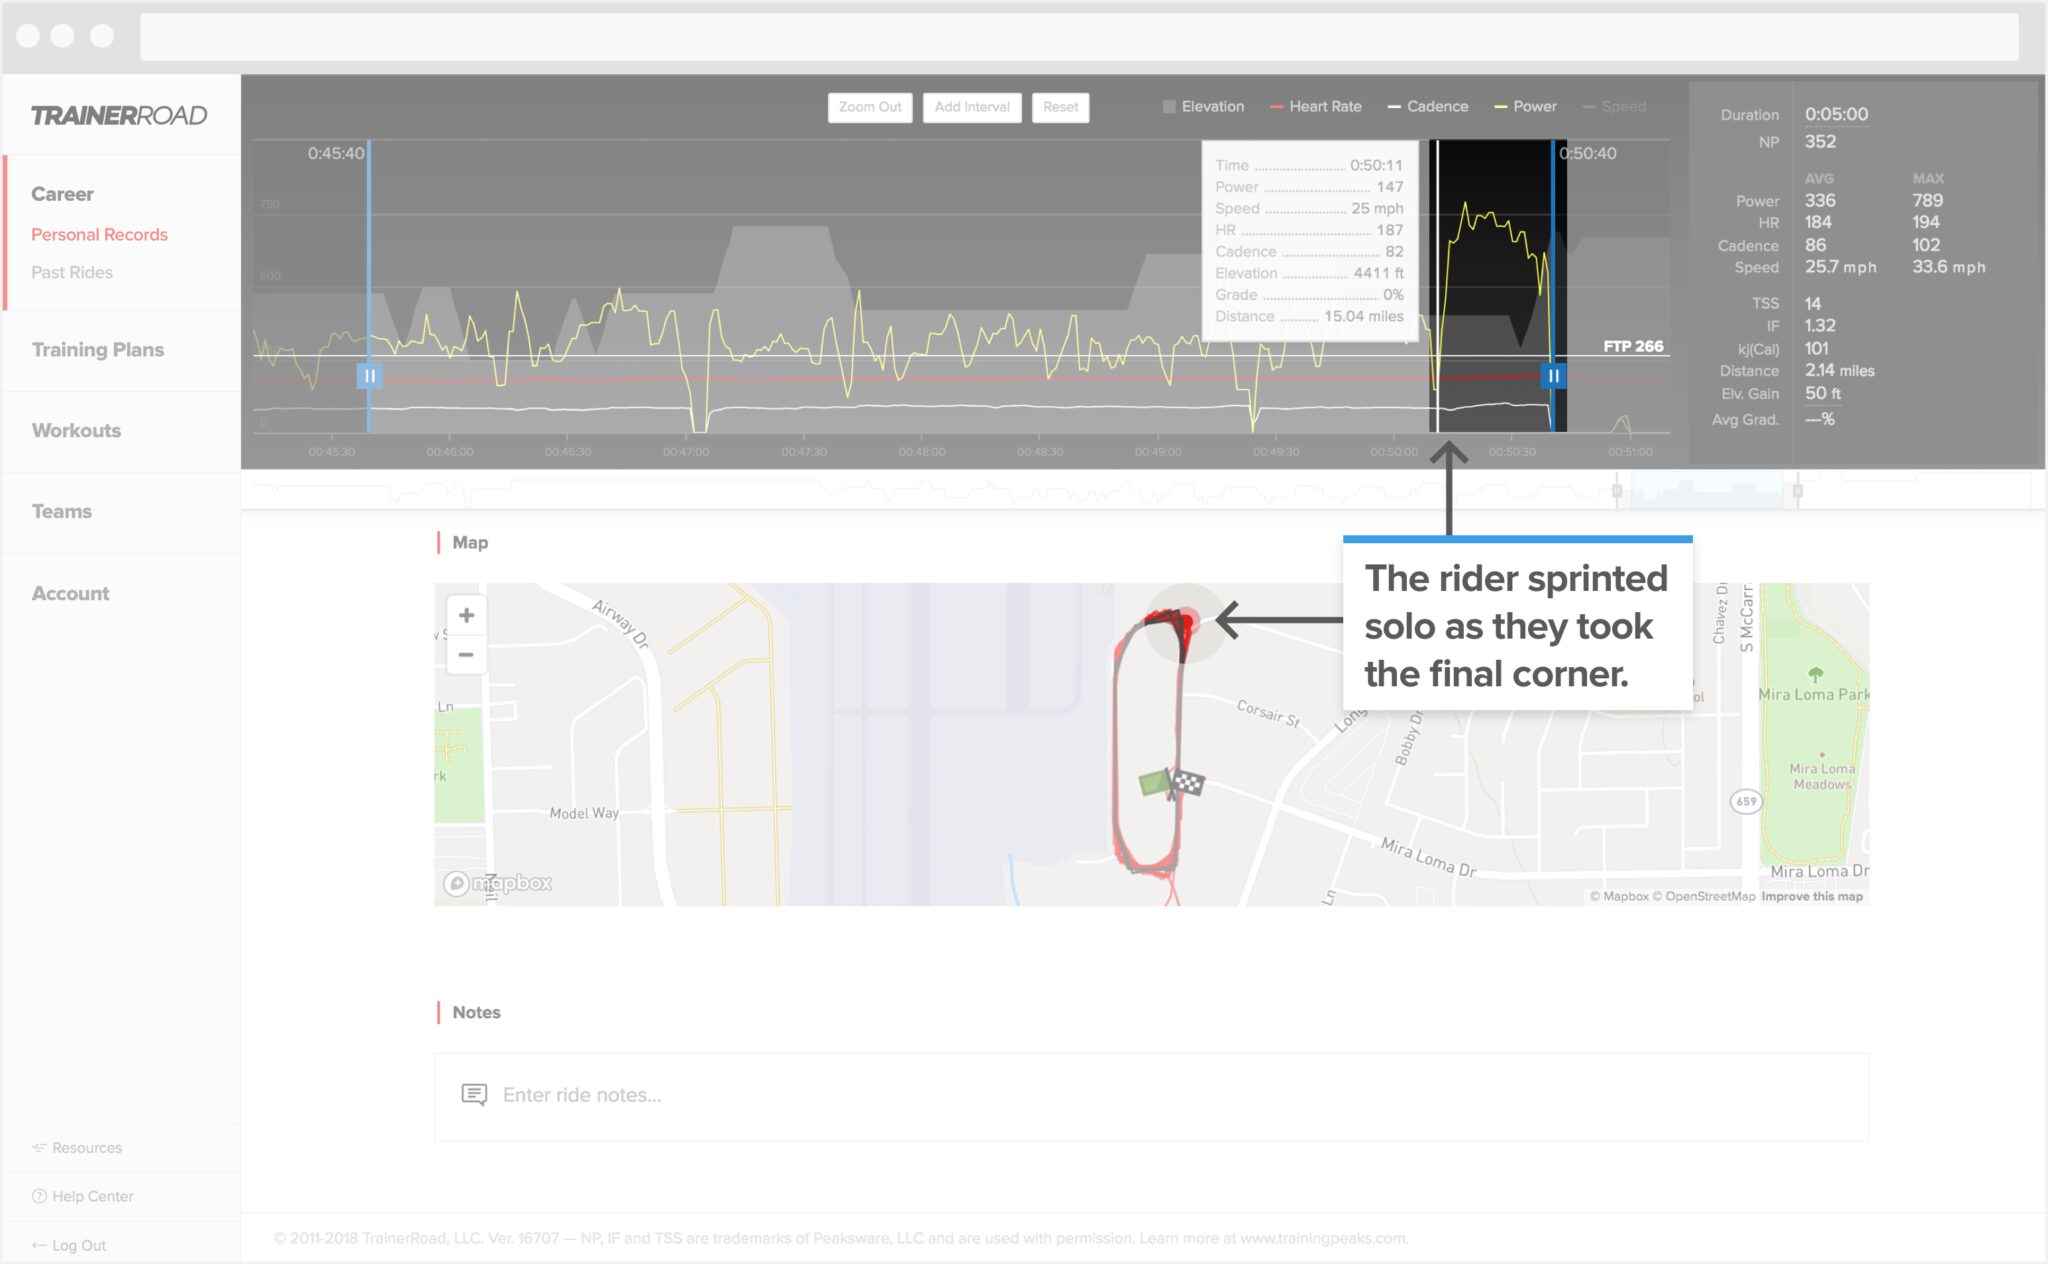
The rider got out of the group to start their sprint as soon as they made the turn. The rider now knows for next time they need to work with the other riders better before going for the all-out sprint at the end of the race.
Were my Ride’s PRs stronger than my Season’s PRs?
With Performance Analytics, PRs are grouped into what are called Seasons, custom defined periods of training and racing. This means a rider can get a better view of their current progress by comparing their ride PRs to an entire Season of PRs.
PR trophies appear for whichever Season(s) you achieved new PRs in. “All Time” PR trophies are shown when applicable.
Referencing the same example above, the rider can see the number of new PRs they achieved during their ride, along with which of those PRs were achieved in their “Road 2018” and “‘17-’18 Sea->SF” Seasons.
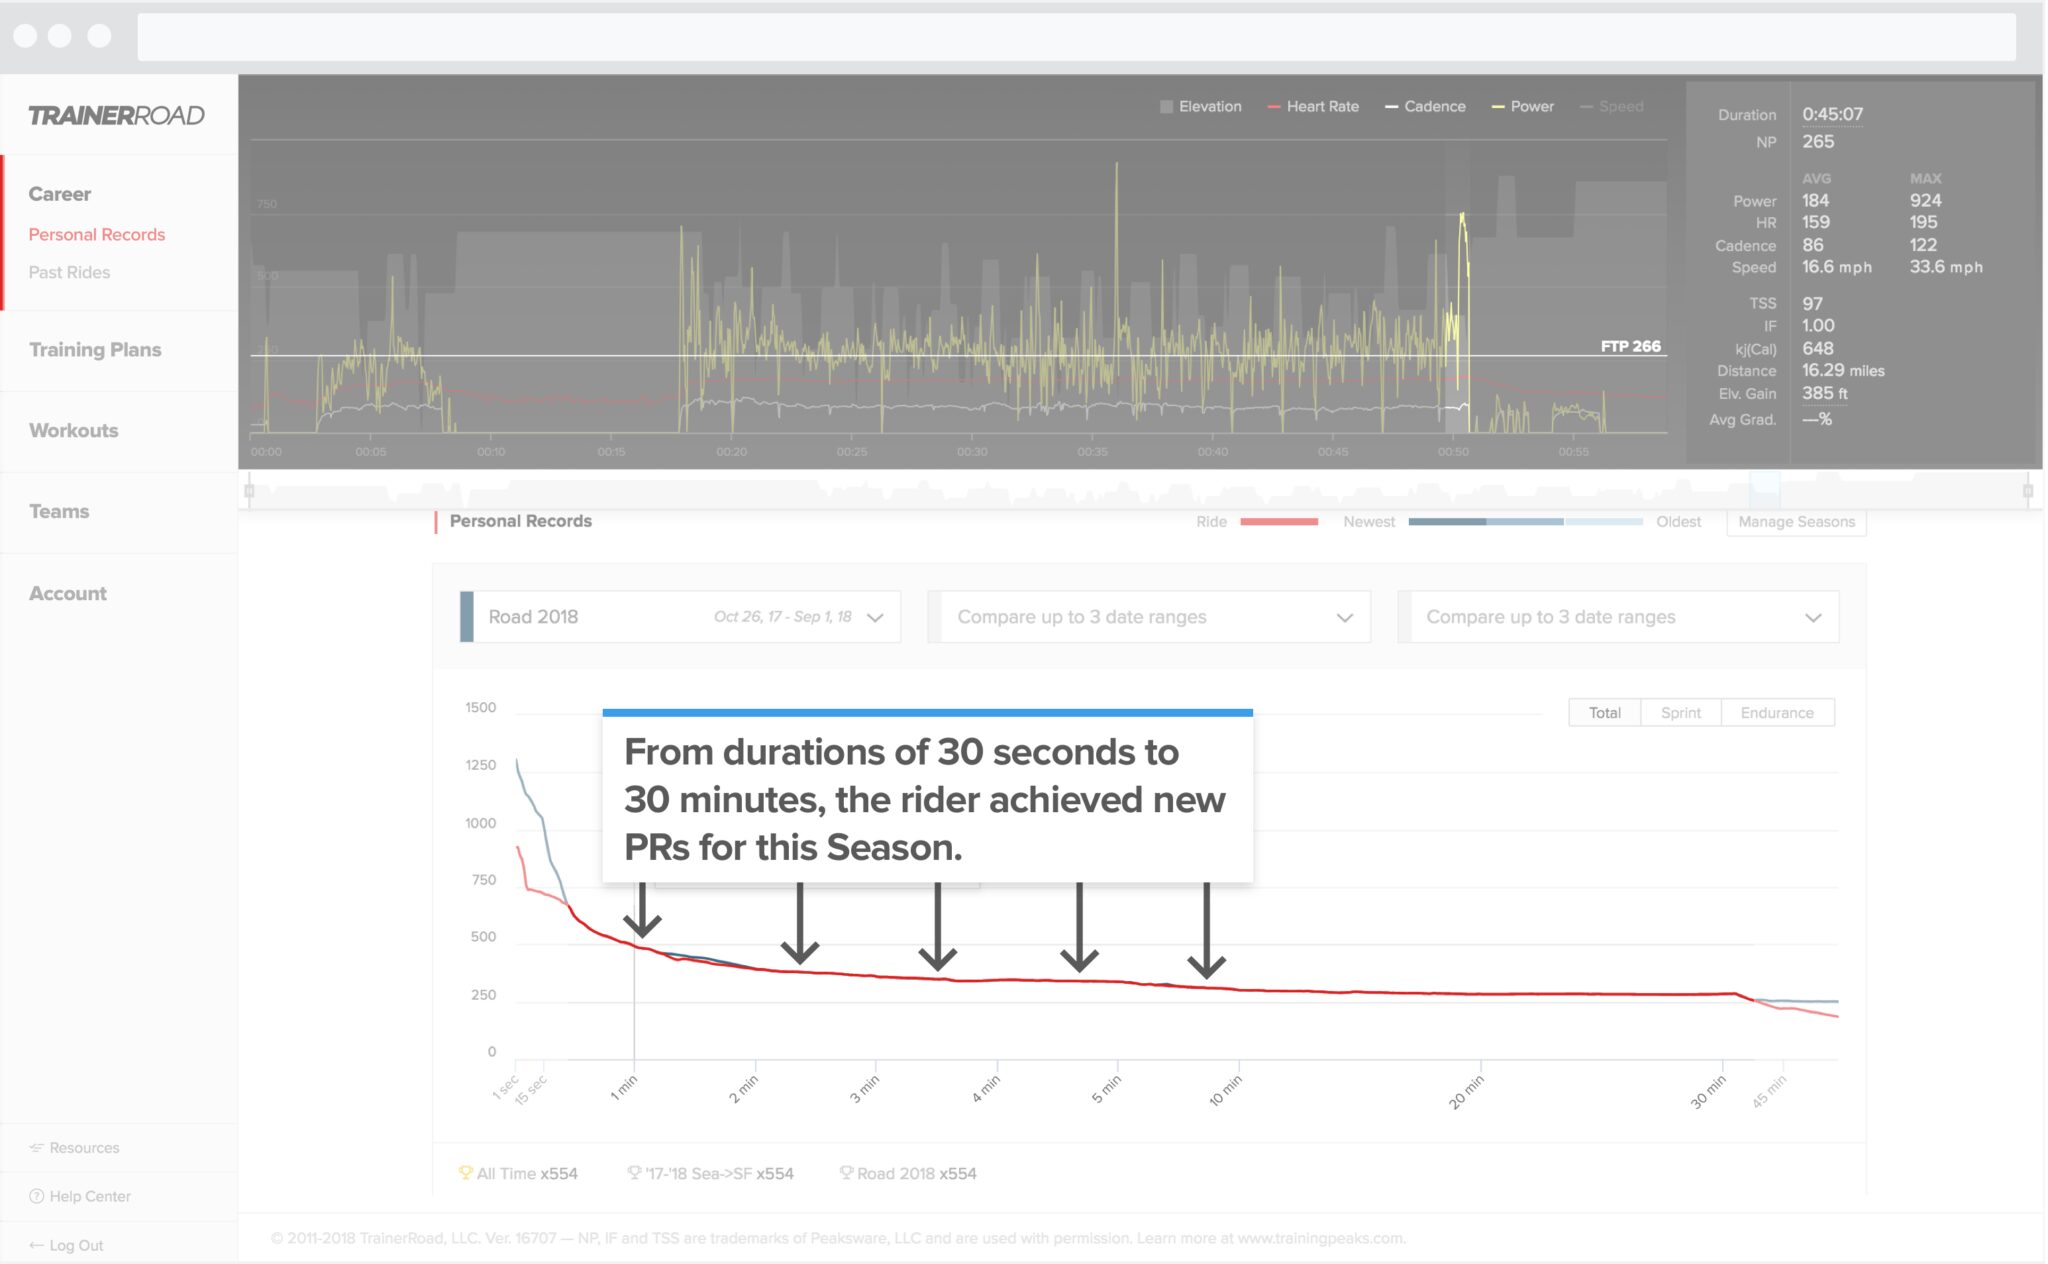
To compare how their ride’s PRs stack up against their current Season’s PRs, the rider can select the “Road 2018” trophy because that’s the Season they’re currently training and racing in. This view confirms this was a breakthrough race for them as they PRed nearly everything!
From durations of about 30 seconds, all the way to 30 minutes, they achieved new PRs. It is only in those areas where the blue line continues to hover above the red where they didn’t achieve new PRs. That’s great feedback to know their training is on track!
To see how the PRs they achieved in this ride compares to PRs achieved in other periods, they can select their “All Time” and/or “‘17-’18 Sea->SF” Seasons from the drop-down menu options.
Could I Have Paced Better?
This file is from a hill climb time trial effort where pacing is important for a good outcome. The Ride Analysis Page shows this rider’s power slowly tapered downward throughout the entire TT, leading to an important discovery: every time they got out of the saddle, their power went too high, resulting in their pacing slowly coming apart throughout the ride.
Let’s look at how we can verify that below.
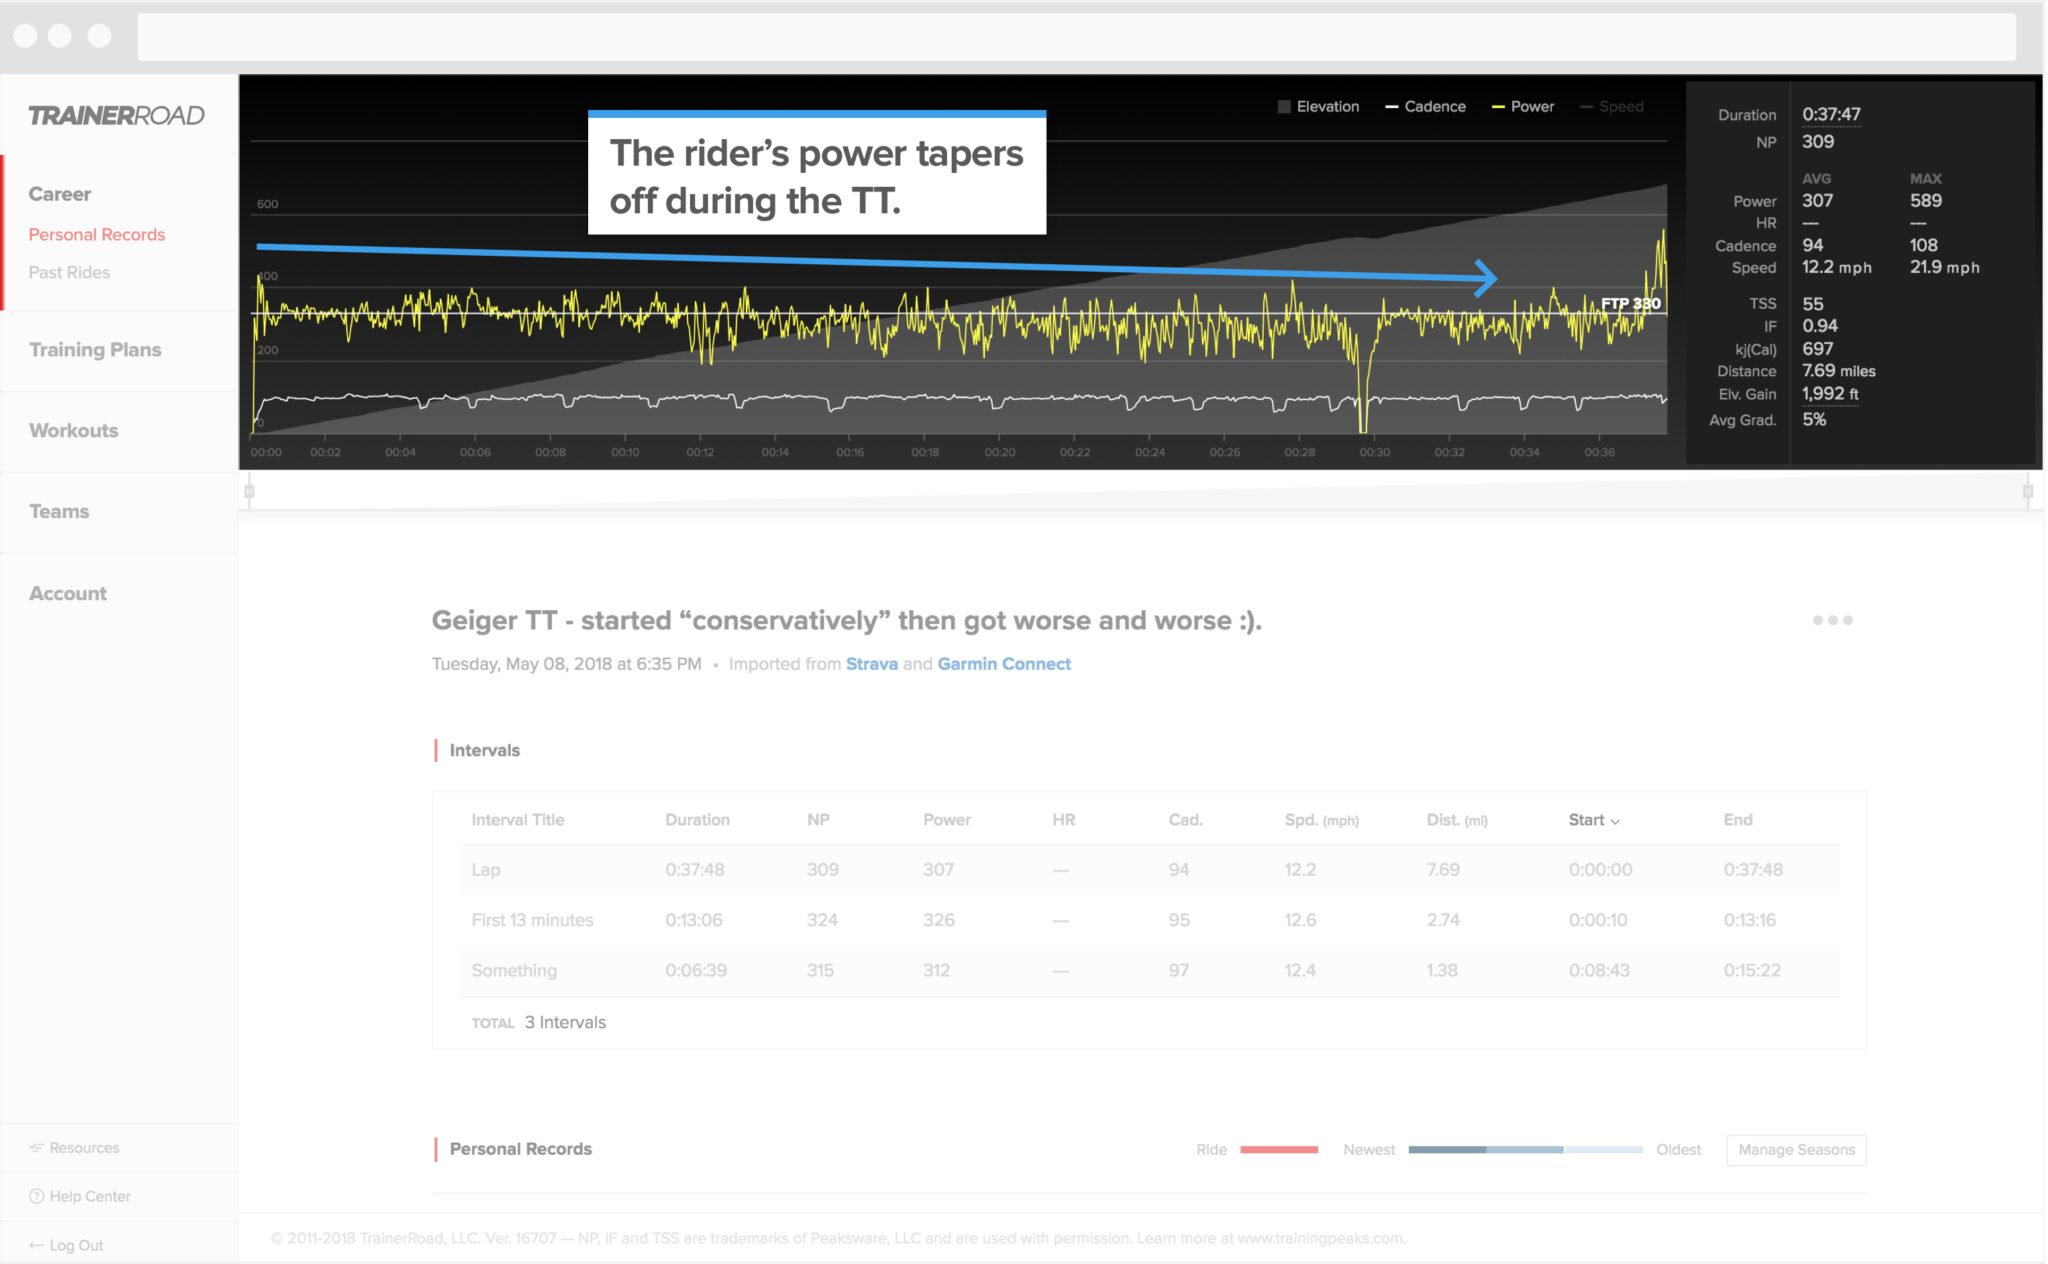
There’s a short flat/downhill section where we see power drop significantly, then pacing continues to struggle during the remainder of the ride. There’s a surge at the end too, which tells the rider some of that power could’ve been better dispersed throughout the rest of the ride.
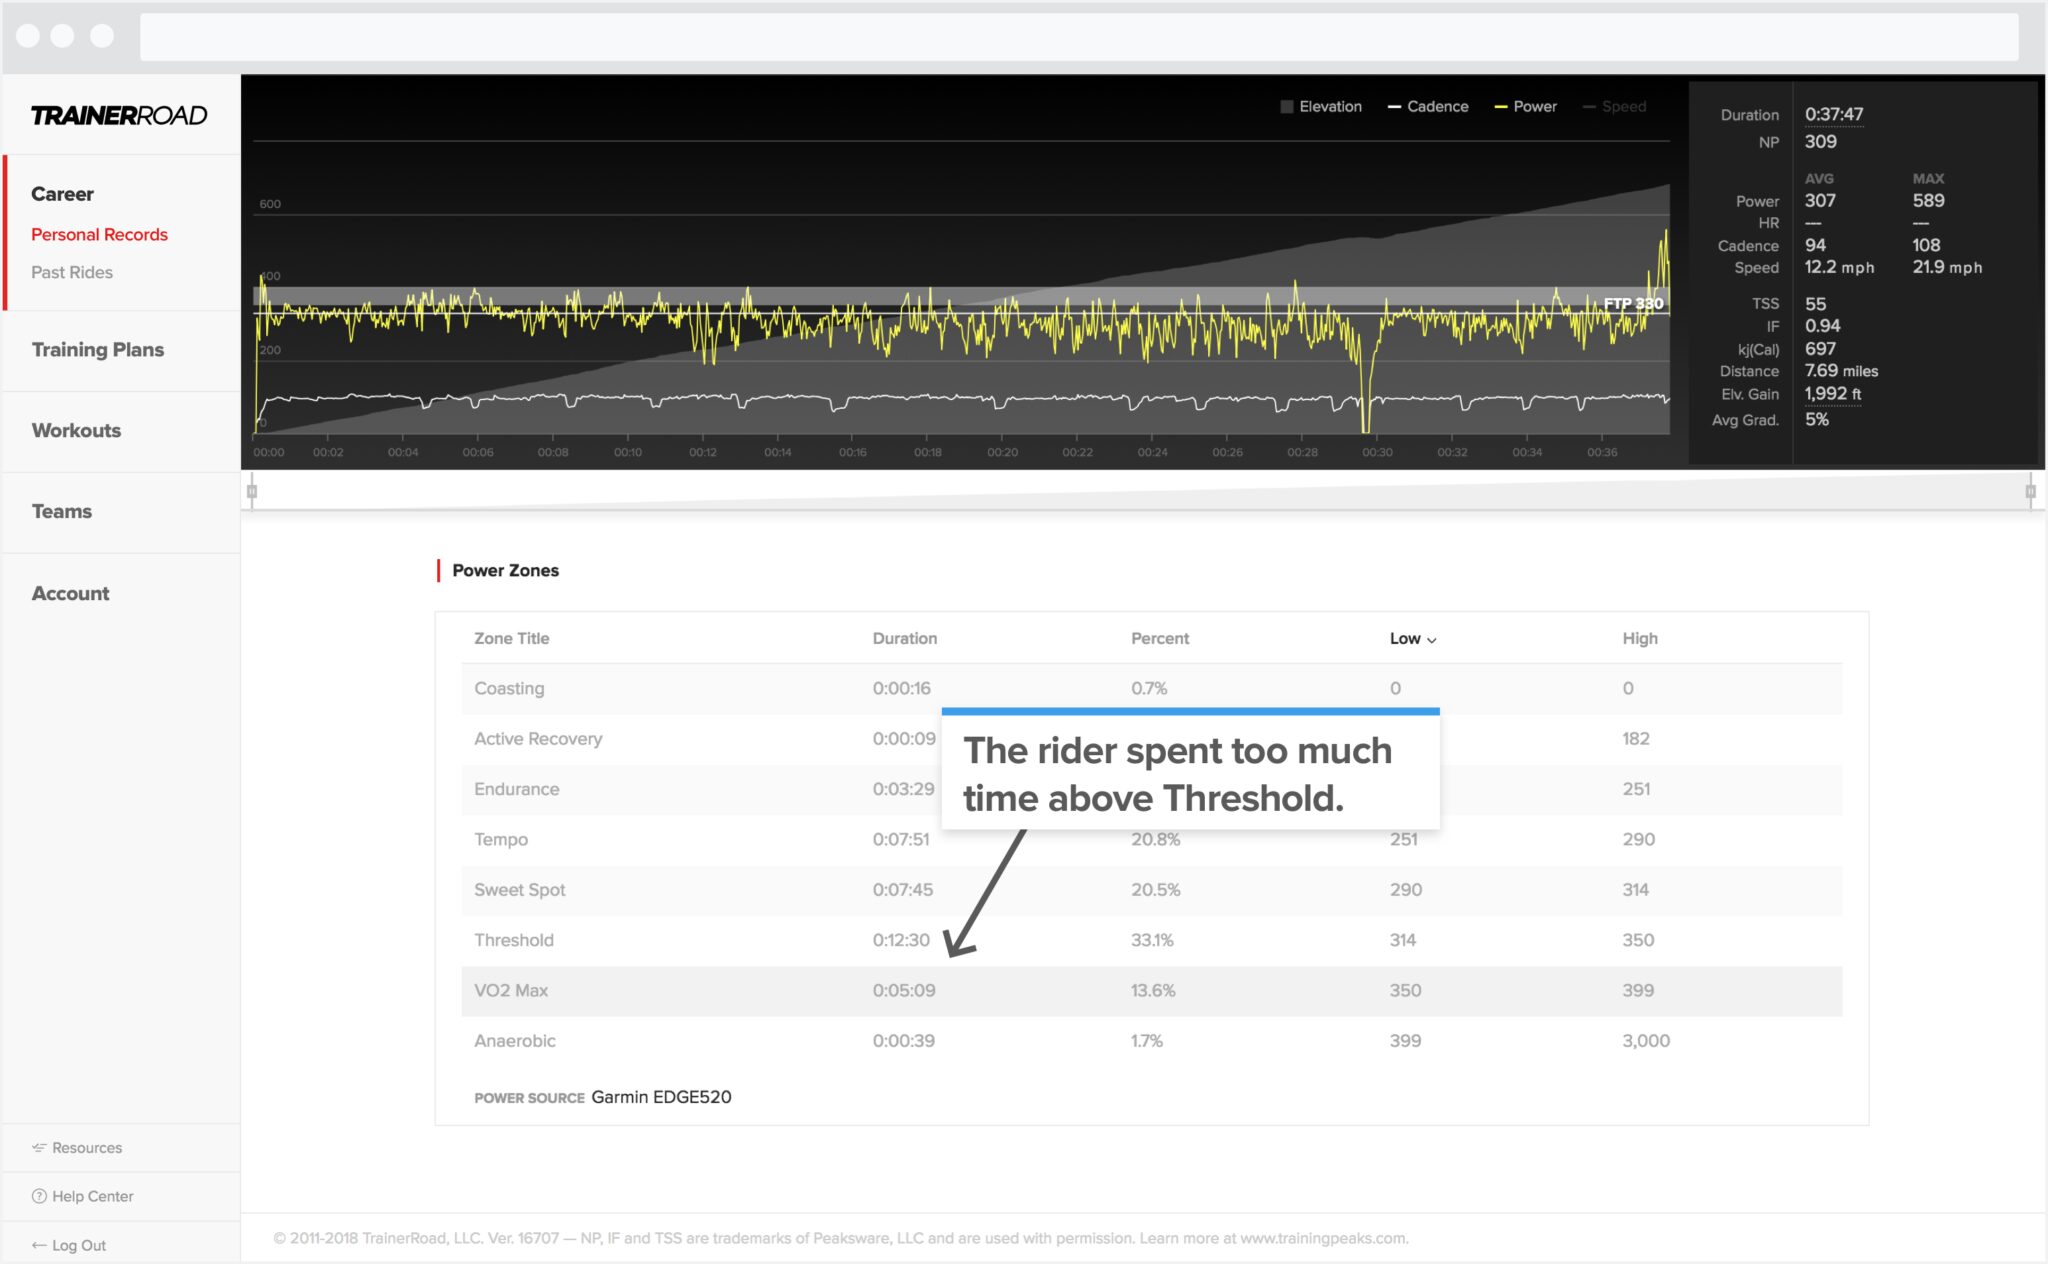
What led to the gradual decline in power? Too much time above Threshold. 15.3%, almost 6 minutes, of the effort was above Threshold in the VO2max and Anaerobic power zones. They can see that from the Power Zone table on this page.
Drill in a little more on the workout chart and the rider can see if any changes in cadence or grade may have affected power output.
Judging by their cadence (the white line graphed on the chart), they can see they got out of the saddle several times. Looking even closer, the spikes in power coincide with when they were getting out of the saddle.
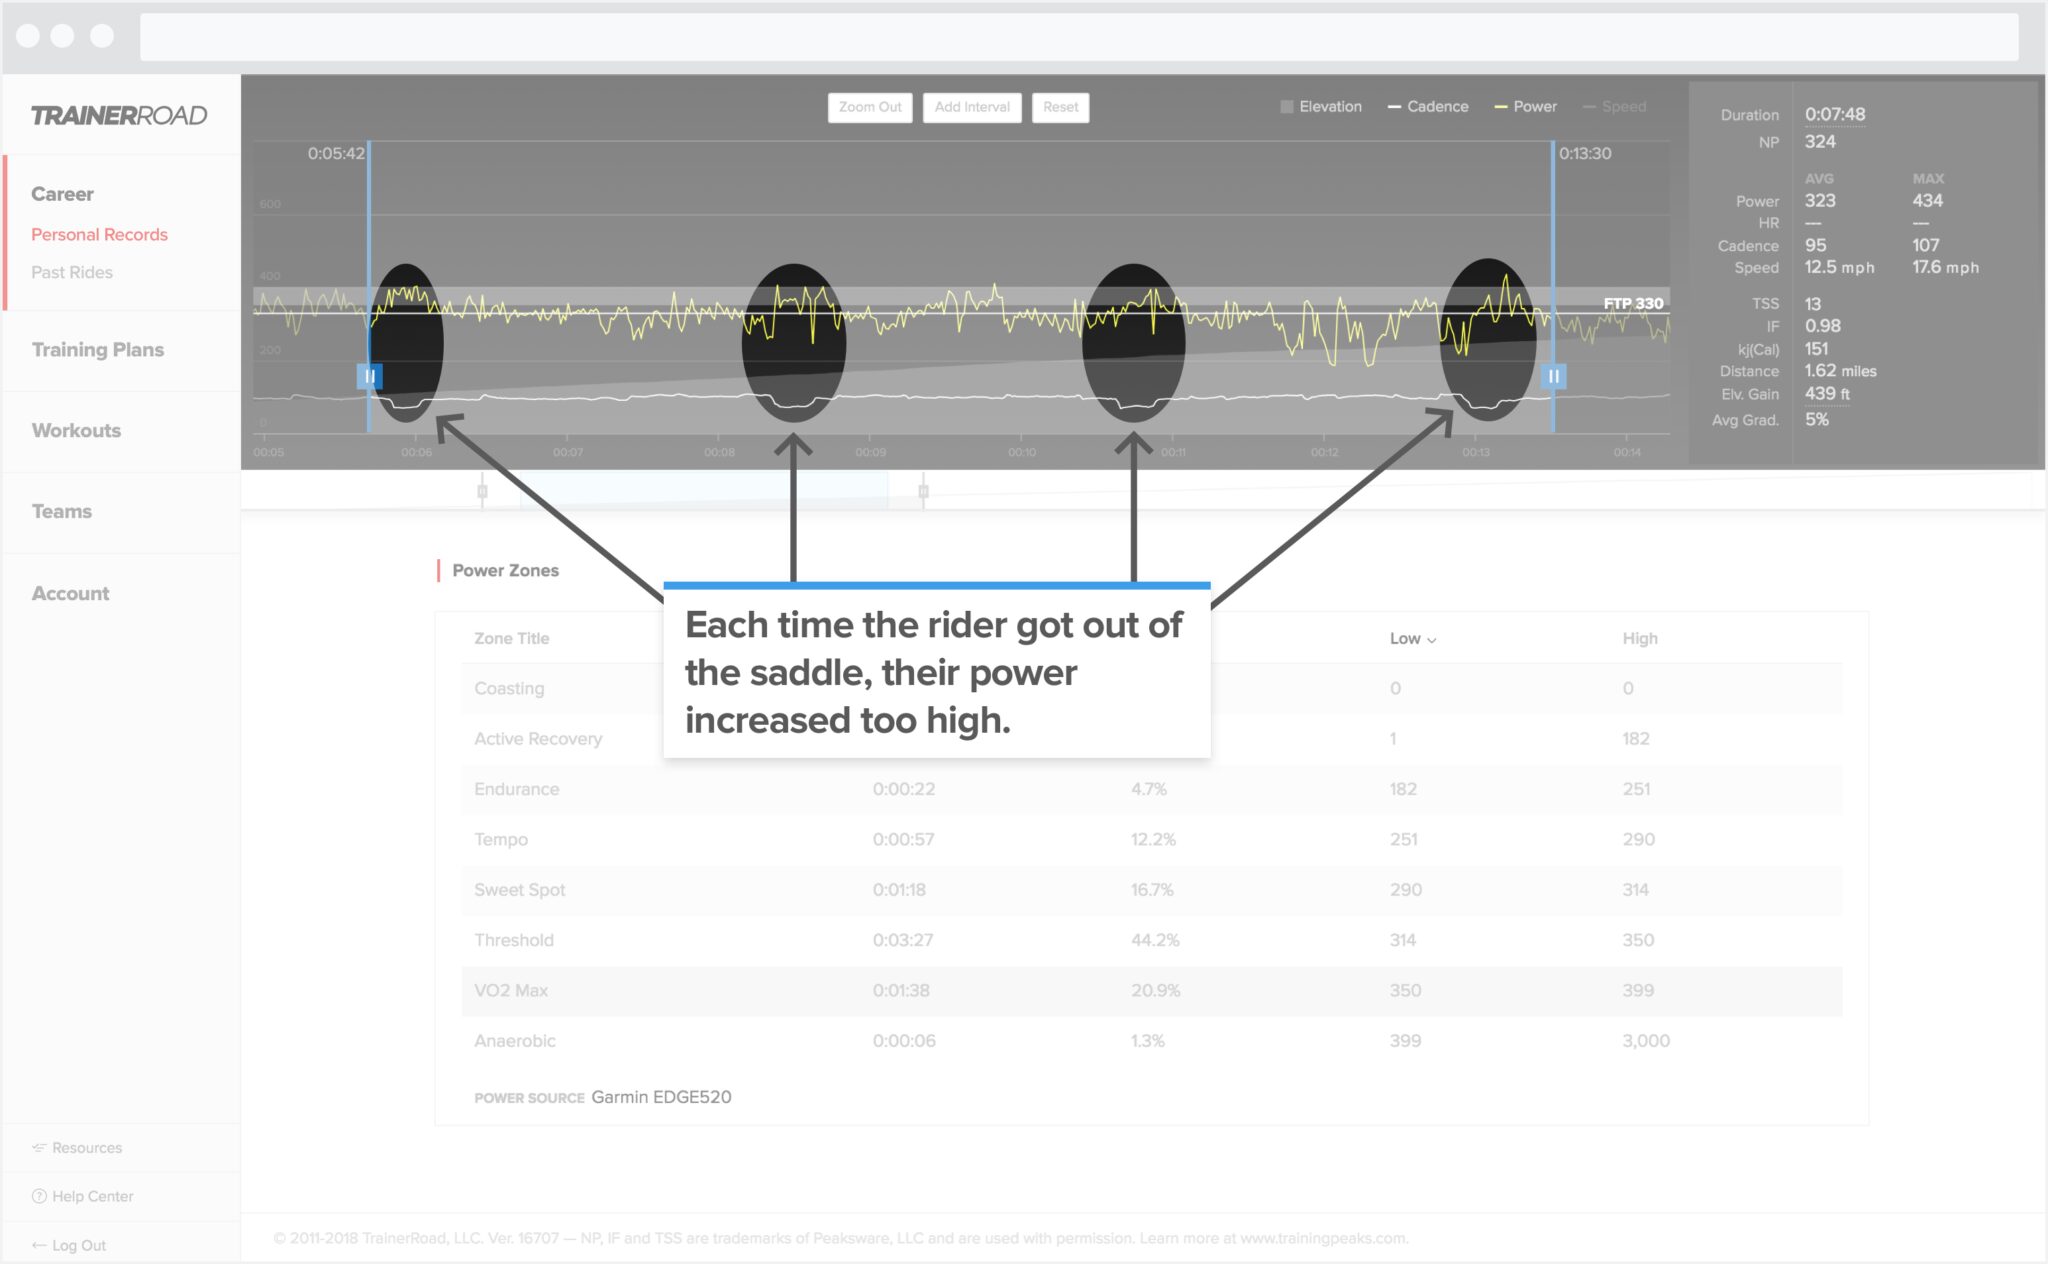
Every time they got up, power dipped into VO2max. Knowing that they downshifted twice each time they got out of the saddle, this feedback tells the rider one click is a better strategy to keep power in the appropriate zone for this type of evenly paced effort.
Analysis for Rides Done Without a Power Meter
If you complete a ride without a power-measuring device, you have the option to estimate training stress based on the perceived difficulty of your outside ride from the Ride Analysis Page.
In your ride feed, those rides have a notification asking if you’d like to estimate Training Stress for each ride.
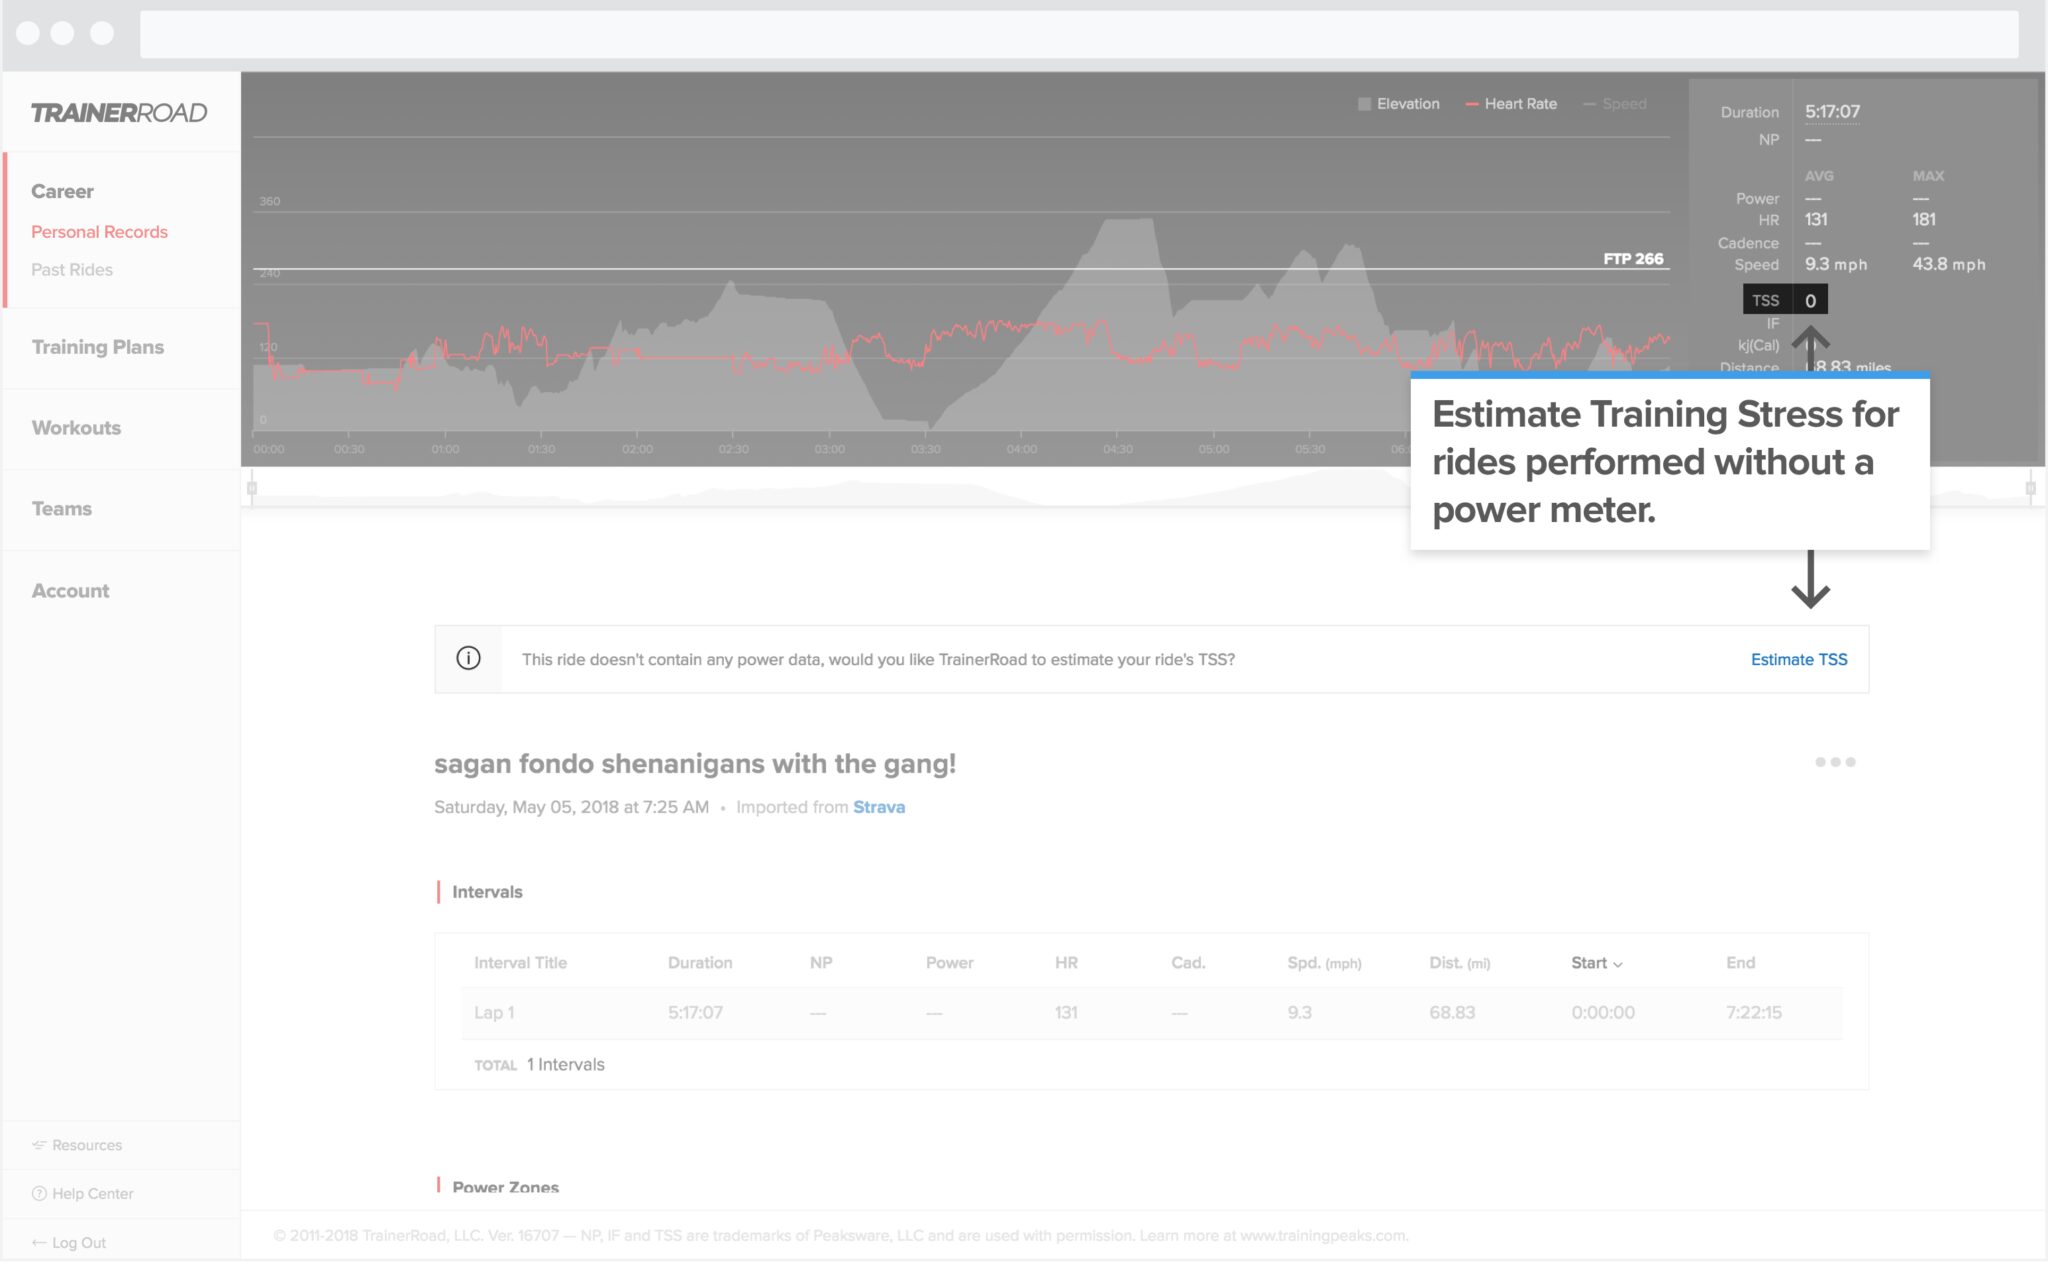
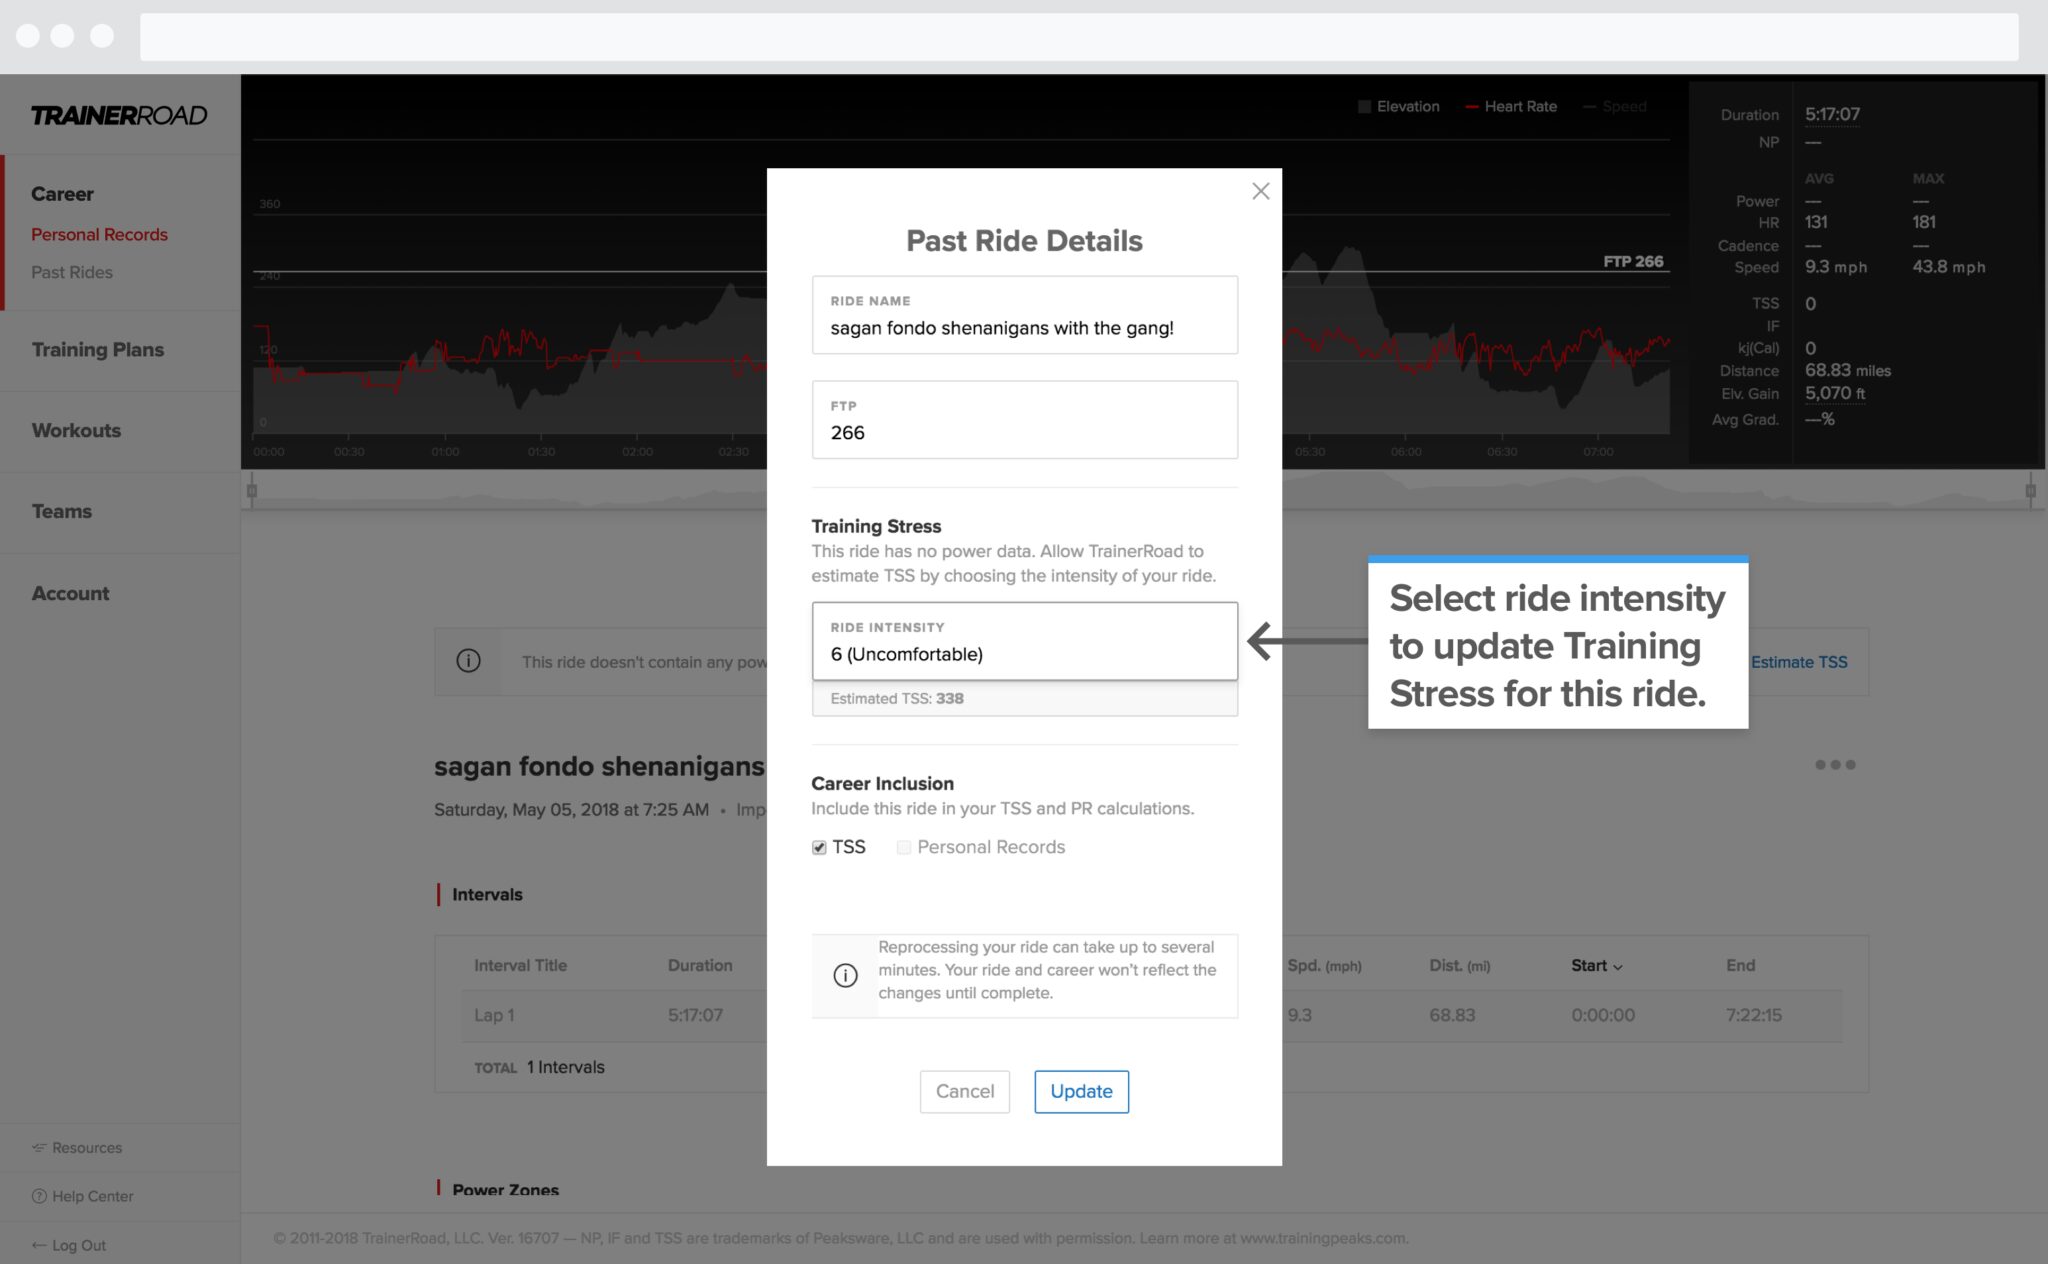
Utilizing this feature allows riders to have a full picture of their Training Stress, even from rides where they weren’t able to use a power meter.
Final Thoughts: Every Ride is An Opportunity to Learn and Improve
As riders, we already know what happened during a ride or race simply by being a part of it. We can usually think back on those pivotal moments in a ride where we made the right or wrong decision, where we could have gone just a little bit harder, or maybe made that move slightly too early. The ability to revisit those moments to find out exactly what could be improved is the advantage Performance Analytics gives every rider whose objective is to become faster and smarter on the bike.
To start using the new Ride Analysis Page, and the rest of the Performance Analytics tools, log in to your online TrainerRoad Career page today.
Get Started with Performance Analytics
Learn More About Performance Analytics
For more information on each feature of Performance Analytics, learn more on our YouTube Playlist and Help Center:
Subscribe to the PodcastTry TrainerRoad