
Normalized Power (NP)® is an adjusted measurement of average cycling power, designed to better reflect the variable experience of riding a bike. How does Normalized Power work, and how can you use it to analyze your performance and get faster?
For more information on Normalized Power, check out Ask a Cycling Coach Ep 199.
What is Normalized Power
Power is key in cycling, but the straightforward objectivity of power data doesn’t tell the whole story. Not all efforts are created equal, and small increases in intensity can result in vastly different experiences and physical costs.
This is especially true for variable rides. The overall average power of hard races and sprint workouts can be surprisingly low because much of the time between tough efforts is spent coasting or soft-pedaling. But every athlete knows that repeated hard surges are far more fatiguing than riding at a steady endurance pace.
Normalized Power (NP)® is designed to account for this fact. Developed by Dr. Andrew Coggan and introduced in the book Training and Racing With a Power Meter in 2006, NP reflects the disproportionate metabolic cost of riding at high intensity, by weighting hard efforts and deemphasizing periods of easy spinning. To put it another way, average power is a simple reflection of what you actually did during a ride, including coasting. Normalized Power approximates what you could have done with that same level of effort, had you ridden at a perfectly steady pace. While this is a bit of a simplification and is not true for every athlete or circumstance, it’s a good way to conceptualize what Normalized Power represents.
Normalized Power Formula
Normalized Power is determined in 4 steps. If the calculation seems a little complicated, don’t worry. TrainerRoad automatically calculates and displays Normalized Power for all workouts.
Finding Normalized Power
- Calculate a rolling 30-second average power for the workout or specific section of data
- Raise the resulting values to the fourth power.
- Determine the average of these values.
- Find the fourth root of the resulting average.
At first glance, this formula might be a little hard to understand, but there are two important facets. First, 30-second rolling average power is used to approximate cycling’s effect on the body, as it takes about 30 seconds for your cardiovascular system to fully respond to changes in effort.
Second, the mathematical manipulation in steps 2–4 places greater weight on hard efforts. To understand how, imagine three hypothetical 30-second averages: 100w, 200w, and 300w. Because 2004 is 16x larger than 1004 (and 3004 is 81x larger), higher initial values have a greater influence on the average determined in step 3. Taking the 4th root of this result (in step 4) brings everything back to the original order of magnitude. As a result, the unadjusted average power of these 3 starting values is 200w, but their Normalized Power is 239w.
How to Use Normalized Power
Because of its versatility and insight, NP is widely incorporated into other metrics. Intensity Factor (IF)® compares a workout’s Normalized Power to your FTP to calculate relative intensity. Training Stress Score (TSS)® is a further extrapolation, using NP, IF, and duration to estimate the training effect of a workout. And TrainerRoad’s Workout Levels use Normalized Power, Intensity Factor, and other variables like interval length and recovery periods to determine a workout’s relative difficulty. If you use any of these metrics to track your training, you’re using Normalized Power, whether you realize it or not. Click here to read more about TSS, IF, and Workout Levels.
Adaptive Training
Get the right workout, every time with training that adapts to you.
Check Out TrainerRoadAnalyzing Rides With Normalized Power
Normalized Power can also be used on its own to directly analyze performance and guide efforts. As a general rule, it should only be applied to efforts longer than about 20 minutes; Normalized Power can be somewhat misleading for shorter durations.
NP is most useful for rides in which average power is likely to be dragged down by coasting or soft-pedaling— criteriums, mountain bike races, or hilly group rides, for instance. When analyzing these rides, Normalized Power is the preferred way to compare your performance against your FTP, since average power during these events is almost always much lower than you’d expect.
Normalized Power can also be a useful point of reference during an event to help you determine whether you’re pacing yourself correctly. For example, it’s common to overzealously ride too hard at the start of a race, only to suffer the consequences later on. By checking your Normalized Power 20 or 30 minutes into an event, you can get a good idea of whether you’ve gone out too hard, and whether you might need to throttle back and rest in preparation for later efforts.
Normalized Power Vs. Average Power
For steady efforts such as time trials or hill climbs, Normalized Power and average power can be almost identical. But the more variable the ride, the greater the difference between average power and Normalized Power, and the more useful NP as a metric for understanding the physical cost of the workout. Let’s examine two ride files to see how this works.
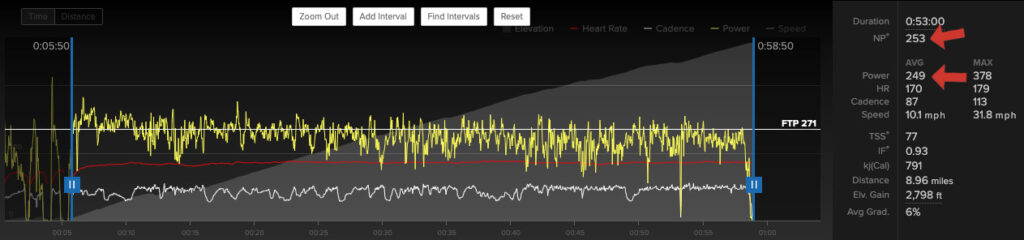
First, a steady effort: a climb up Mount Greylock in Massachusetts. This ascent is steep and unrelenting, aside from a few small respites near the top. I was a bit undergeared and didn’t pace things well, so there were some occasional variations in my power output as I alternated between standing and sitting. But the effort was quite consistent overall, with an average power of 249w and a Normalized Power of 253w for the 53-minute effort. Both metrics accurately capture the nature of the climb, falling squarely within my Sweet Spot power zone.
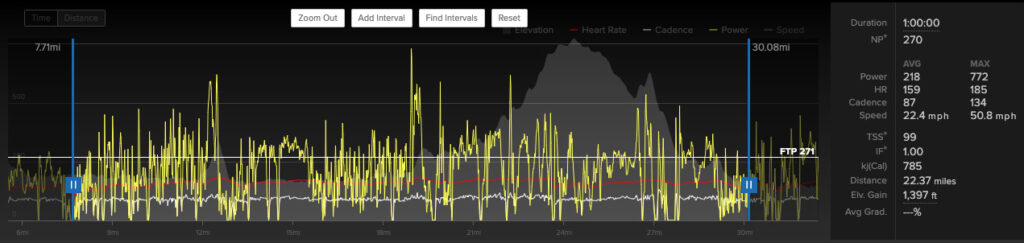
Compare that with a more variable effort: a tough group ride on rolling terrain with one major climb. During the hardest hour of this ride, I responded to attacks, pulled a few times at the front, and successfully stuck with the lead rider up the climb, but my overall average power was only 80% of my FTP at 218 watts. On the other hand, my Normalized Power for this same section was 270w— 1w below my Ramp Test FTP, and representative of what felt like a maximal effort. In this case, Normalized Power more accurately captured the experience of variable, high-intensity riding.
In Conclusion
Every cycling metric has its place, and none capture the entire picture of real-world riding on their own. But Normalized Power (NP) may come the closest, realistically representing the metabolic and physiological consequence of variable efforts. By using Normalized Power to track your performance, you can better understand your abilities and achievements, across different disciplines and terrain.
NP, IF and TSS are trademarks of Peaksware, LLC. Learn more at www.trainingpeaks.com