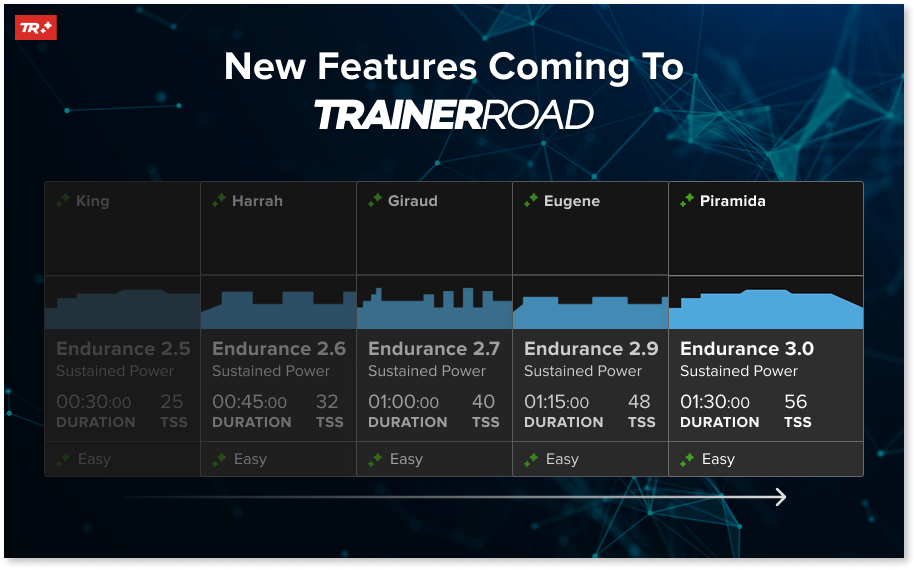
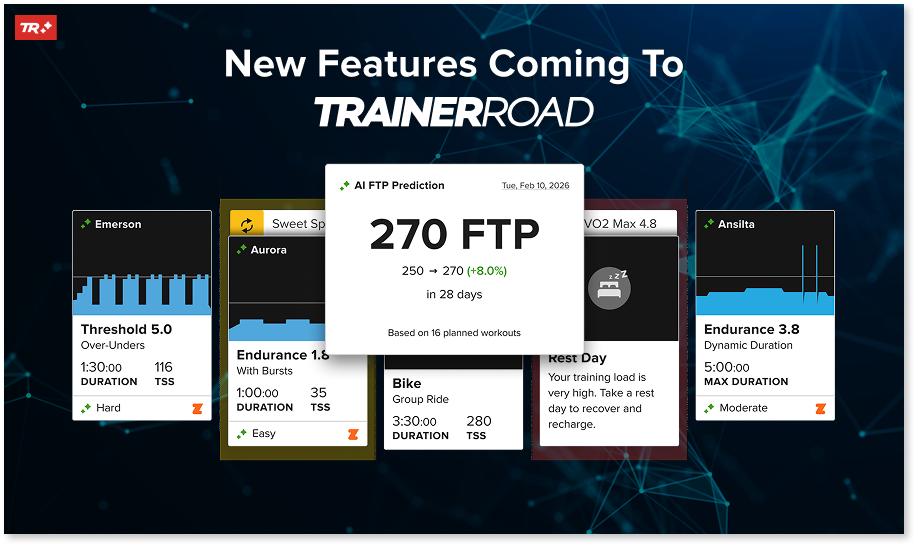
Introducing Performance Analytics
Today I’m excited to announce a new major feature area for TrainerRoad. We call it Performance Analytics.
We think that cycling analytics today are overblown, overcomplicated and bloated for 99.9% of riders out there. Our goal was to develop an easy-to-use set of tools that show you exactly what you need to become faster, while leaving out the rest.
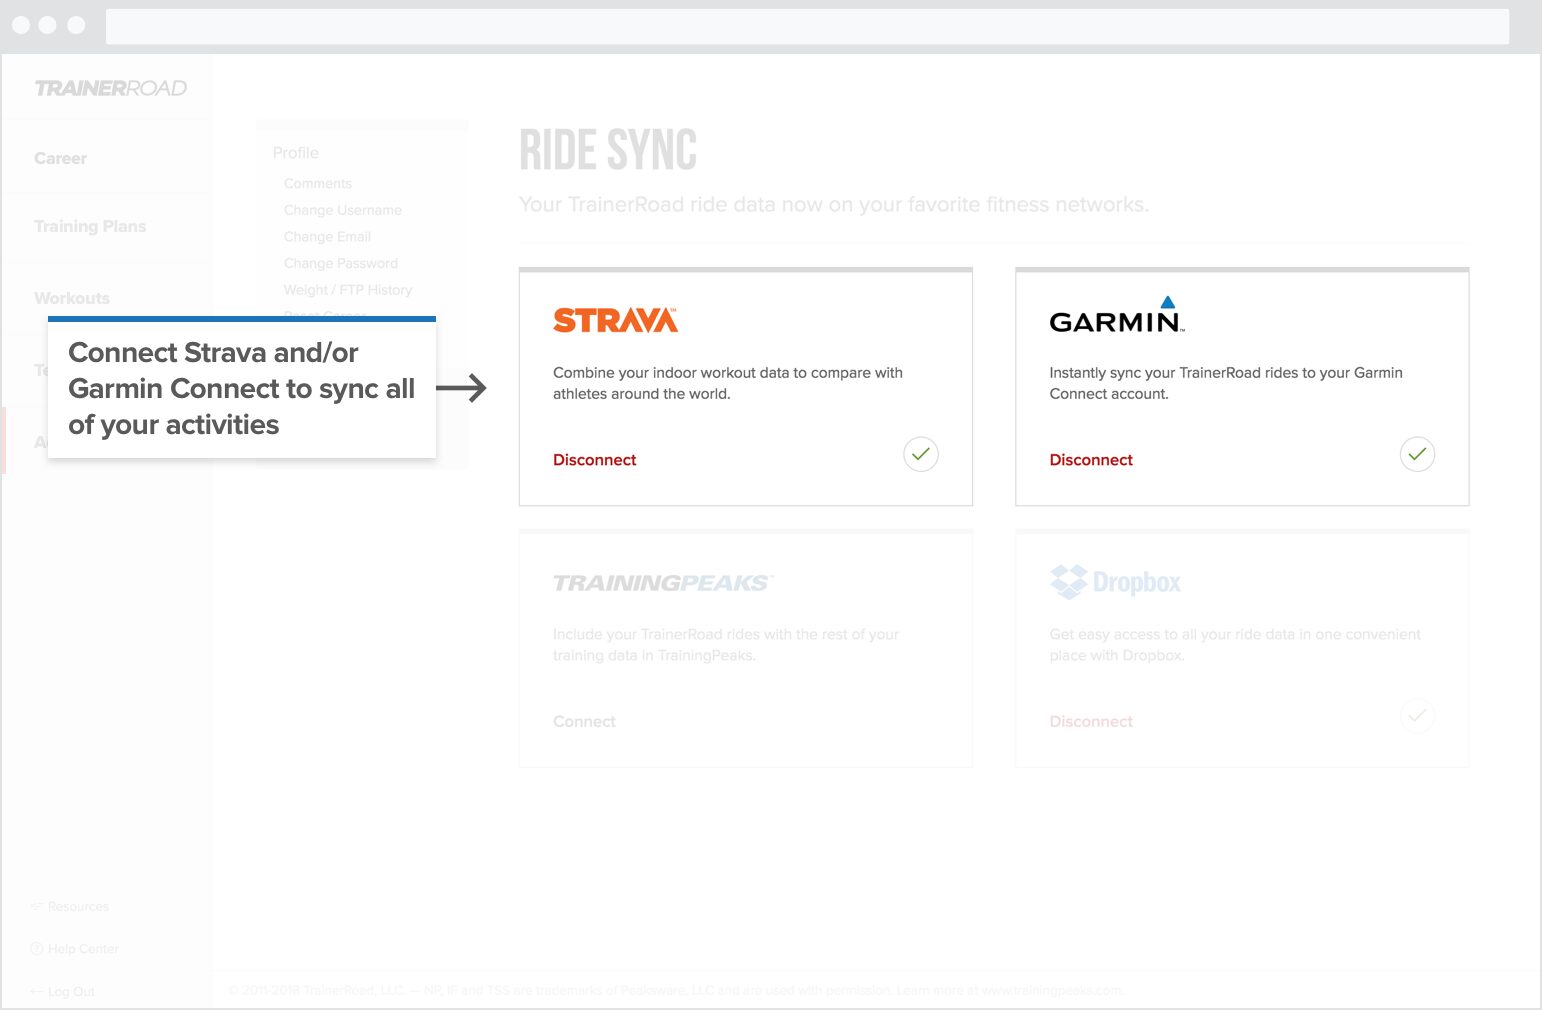
Bring your outside ride data into TrainerRoad
To get started you need to sync your account with either Strava or Garmin Connect (we recommend both; we’ll make sure you don’t get duplicates). All of your future cycling activities will now sync to TrainerRoad.
Ride Backfill (Highly Recommended)
Our Personal Record and Training Stress features work best if we’ve got historical data for you.
Strava
If your activities are on Strava, we’ll start pulling in your past rides as soon as you sync with Strava.
Garmin Connect
Garmin Connect doesn’t have a way to download your ride history at the time of this post. That means we don’t have a way to import your historical data if it’s only on Garmin Connect and not Strava.
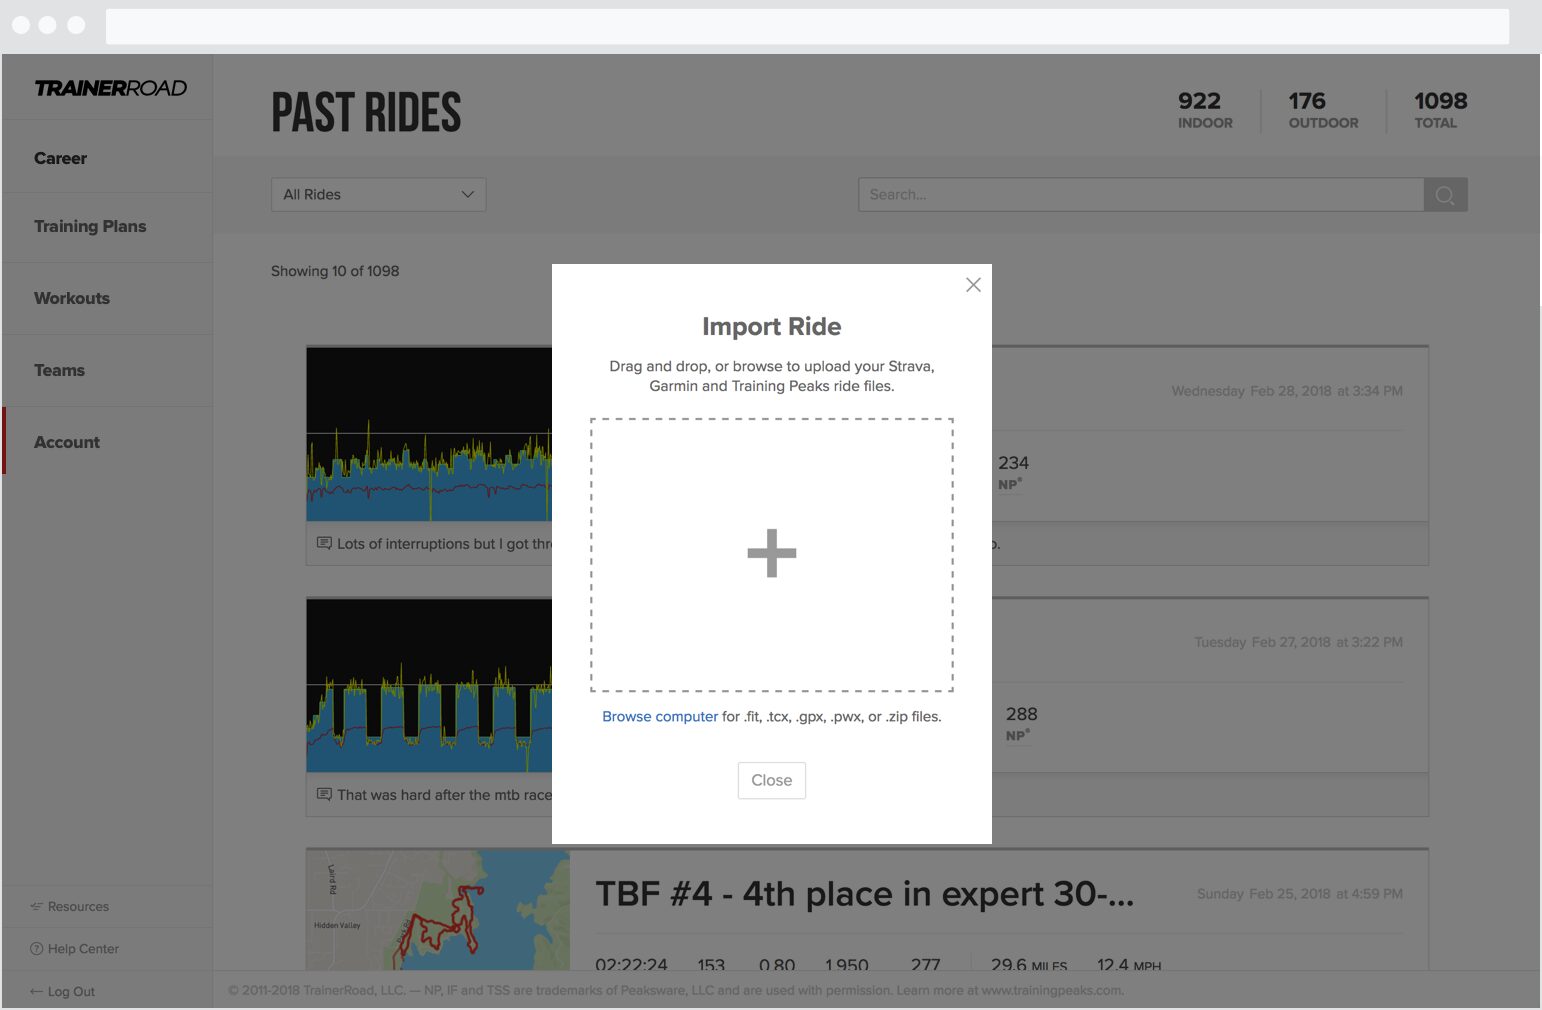
Manual Files
Some of you might have stored .FIT or .TCX files on your computer. You can zip them up and import them into TrainerRoad from the Past Rides page.
Process vs. Results
Performance analytics is built around the concept of improving your behavior to influence your results. Or in other words, what can I change in my day-to-day training to get as fast as possible?
Consistent Quality (Training Stress Chart)
The number one way to get faster and the number one thing that we see people struggle with is consistent quality in their training.
We’ve developed an easy to use Training Stress Chart to help combat that.
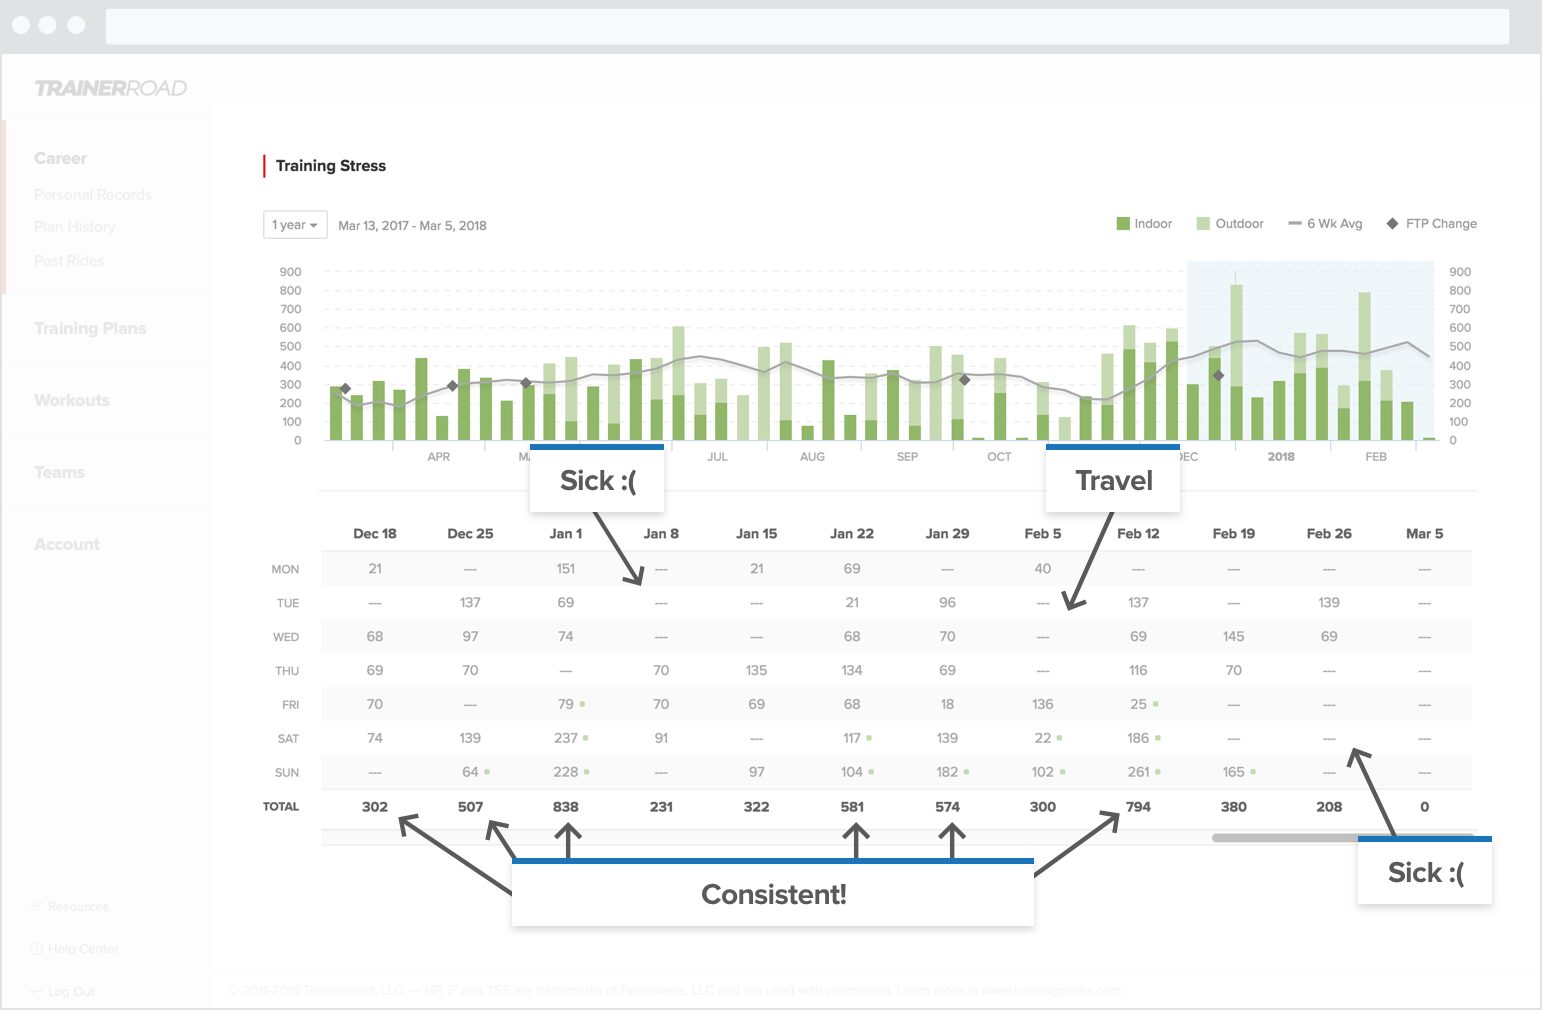
The Training Stress Chart graphs both your indoor and outdoor Training Stress, six-week average Training Stress, your FTP changes and has a super cool drill-in feature that makes it easy to see what rides contributed to your Training Stress that week.
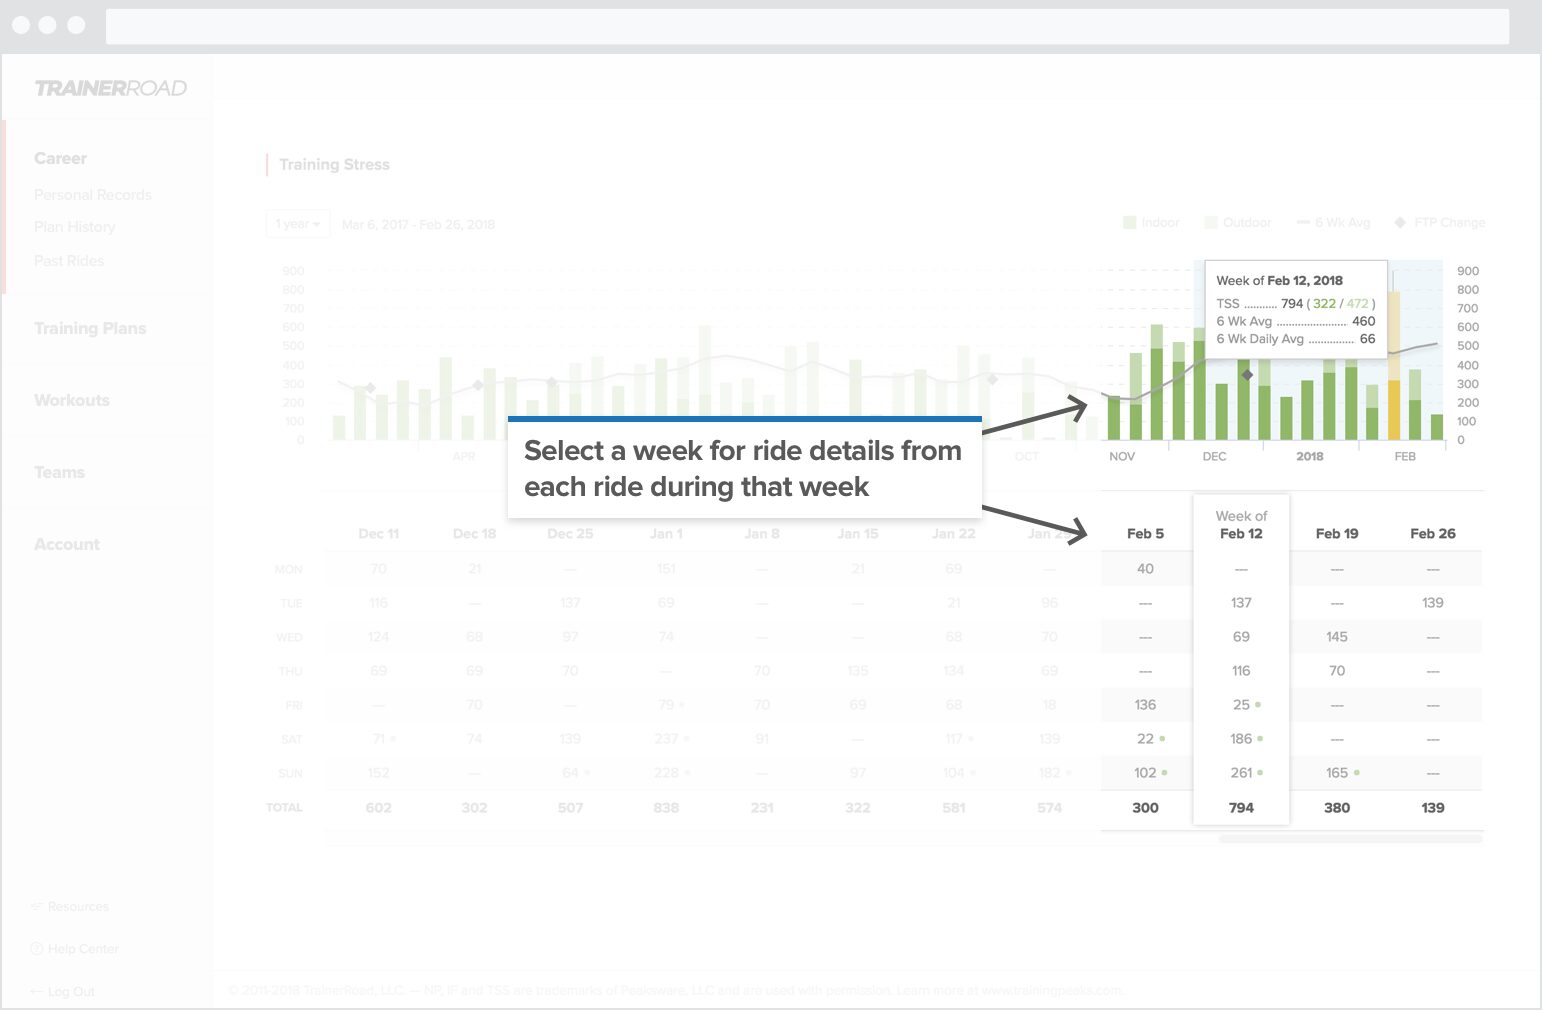
Navigating the Chart
As you move your mouse over the chart, the bottom drill-in detail automatically updates to reflect that period. You can then click on a week to drill in.
Identifying Problems
The Training Stress chart can display a maximum of 4 years of Training Stress history. This view shows you where your strength and weaknesses are.
My graph shows an “up and down” consistency model which is my biggest problem (and I suspect a lot of people reading this). You can see this by following the grey six-week Training Stress line.
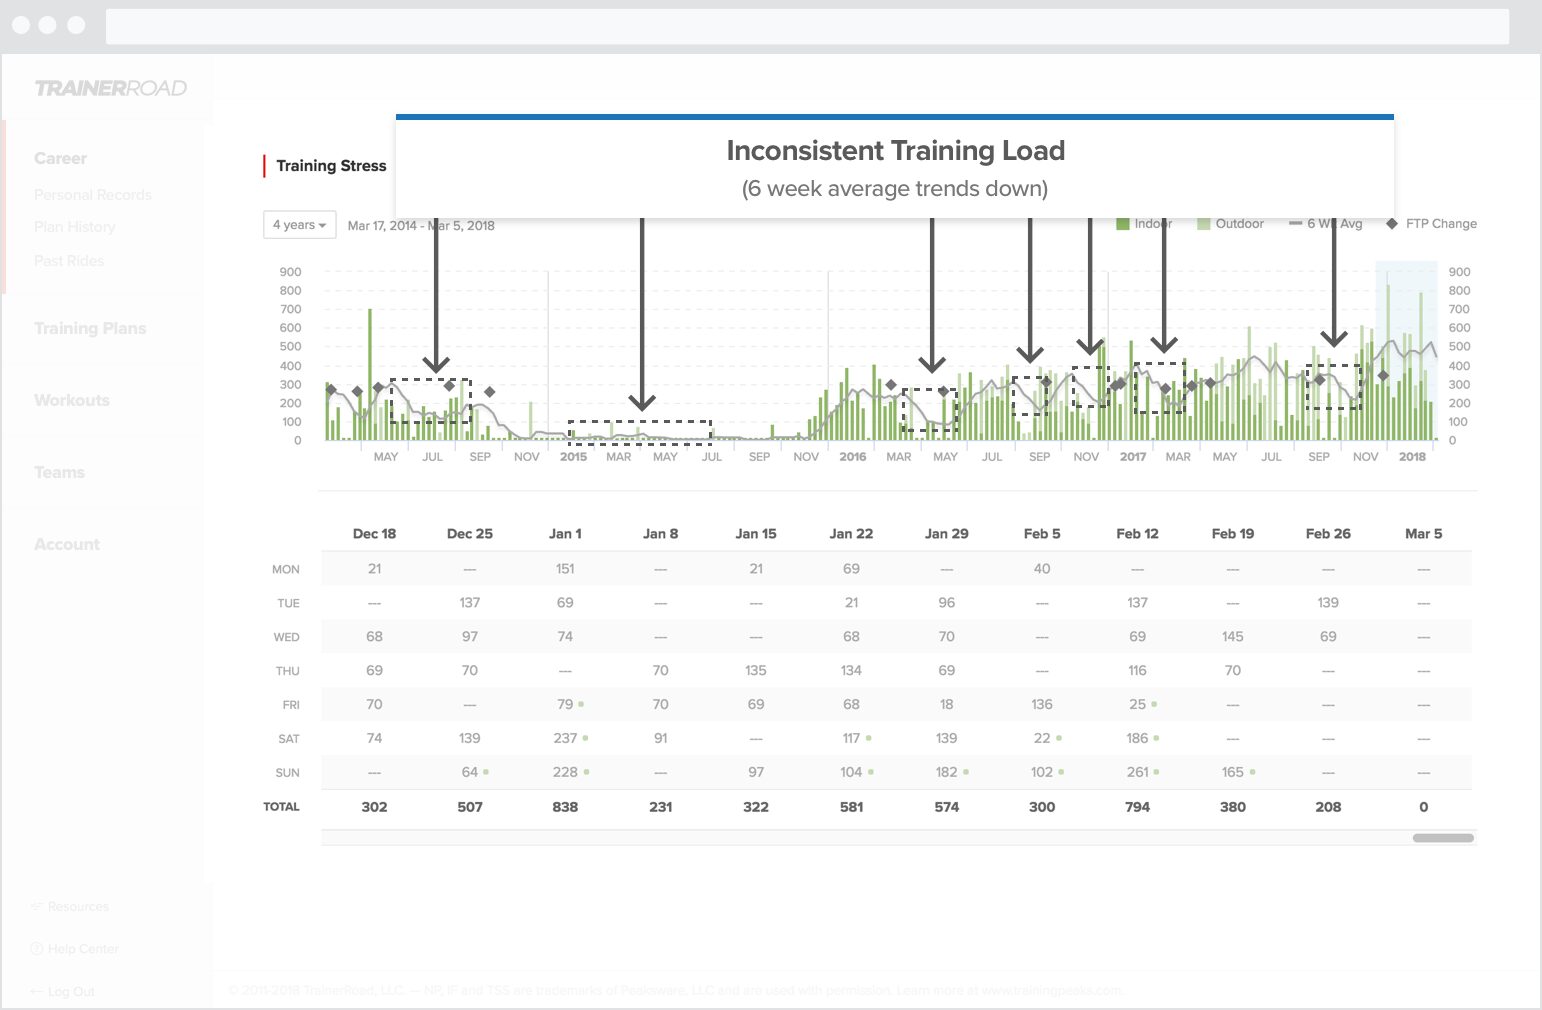
My excuses are varied (sickness, travel, surgery and broken bones) but the result is the same: when I’m consistent with my quality my FTP goes up.
Coming up with Process Goals
I have a personal goal to keep my six-week Training Stress line above 400 per week. Maintaining a high Training Stress goal like this is easy to do by following a mid-volume TrainerRoad plan (and it will also make sure that I peak for my A Race).
I plan on keeping my six-week average Training Stress this high until after the Leadville 100 (August) which is my second A race of the year.
The Training Stress Chart keeps me honest against my goal. It also lets me combine inside and outside rides in a single graph to better track my Training Stress.
Historical FTP and Training Stress
Some of you might not have four years of TrainerRoad data. Fear not! We’ve got two options for you:
1) We’ve automatically put in FTPs based on your peak power outputs in the ride files we analyzed. If you’re happy with your FTP history, you don’t have to do anything.
2) You can manually edit your FTP history. When you save your new FTP, we’ll kick off a job to reprocess your Training Stress for each outside ride.
Training Stress Chart Drill-In
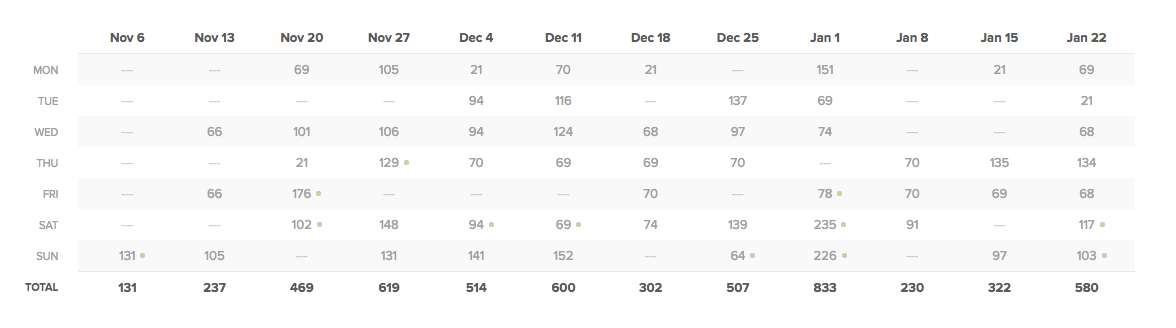
The bottom Training Stress table makes it easy to see how you earned your Training Stress for that week. Rides performed outside of TrainerRoad are marked with a green dot, and you can click on a week to view the actual rides.
Do you end up taking a week off after you do six days in a row? Maybe you should consider taking a planned rest day after every third workout to become more consistent.
Do Tuesdays always seem to get skipped? Schedule your easier, less important workouts there or have them be complete rest.
When you had your best training sets, what did your daily breakdown look like? Can you repeat this in the future?
The Training Stress Chart answers these questions.
Personal Records = Personal Wins
Power based Personal Records are my favorite kind of feedback. It doesn’t matter who showed up to the race, if it was super windy or if my technical skills were off that day. I can still get a personal “win” by laying down the power.
The problem is that current Personal Record charts were broken in my opinion. They always grouped things into years or the last 6-weeks; these were hardly meaningful in my training.
Introducing TrainerRoad Seasons and SeasonMatch
Fitness is cyclical, meaning you’re usually (if training correctly) stronger at the end of the season compared to the beginning.
There’s often a period of rest after a season where a slight decrease in fitness happens; then you start with a higher fitness point compared to last season.
There was no way to easily compare fitness at different points in a season until today.
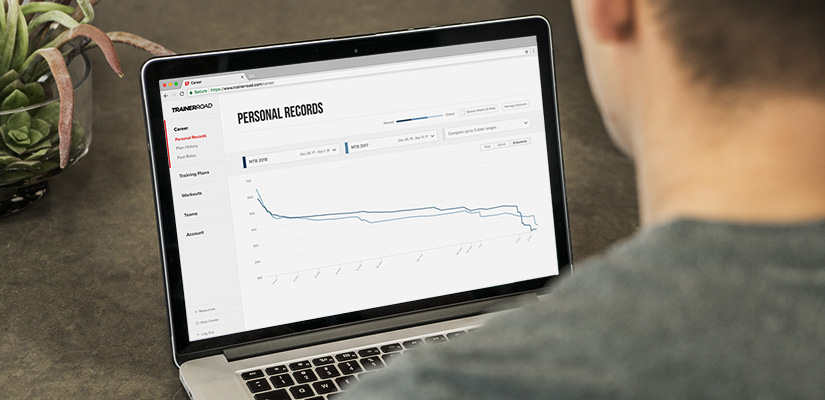
TrainerRoad Personal Record Chart
We re-imaged what a Personal Record chart should be.
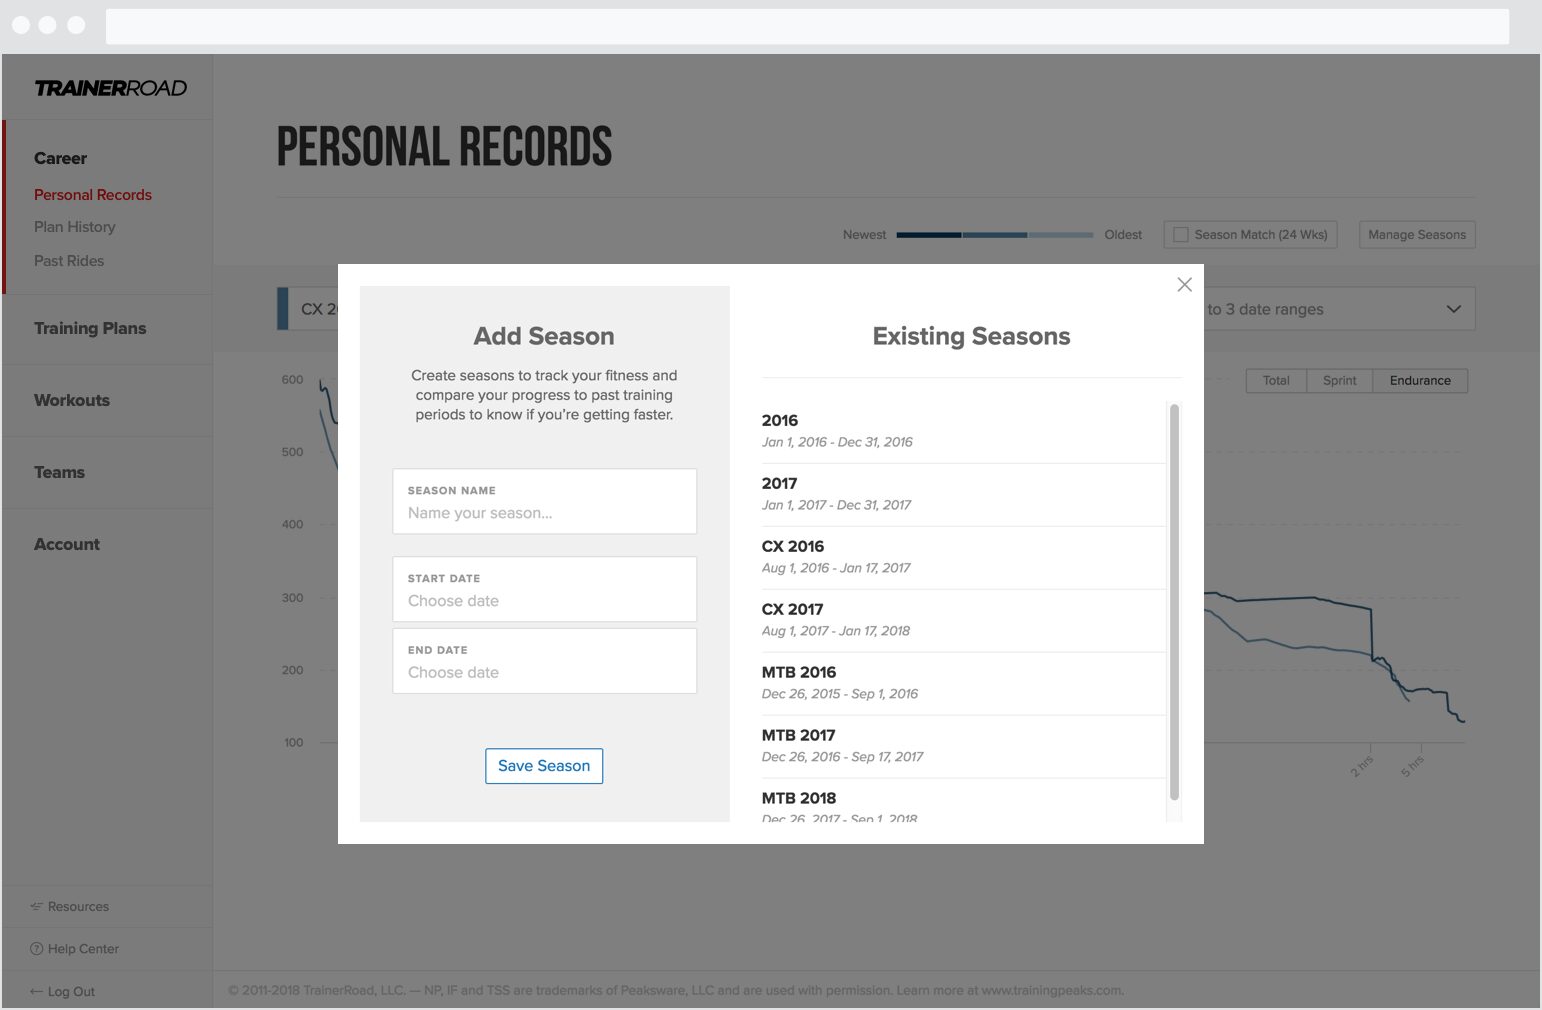
The first thing we thought of is that we wanted to compare one season to another. These often didn’t line up precisely with years and often overlapped each other. For instance, Road season might start in March and go until Sept, while ‘Cross season begins in August and ends in mid-January.
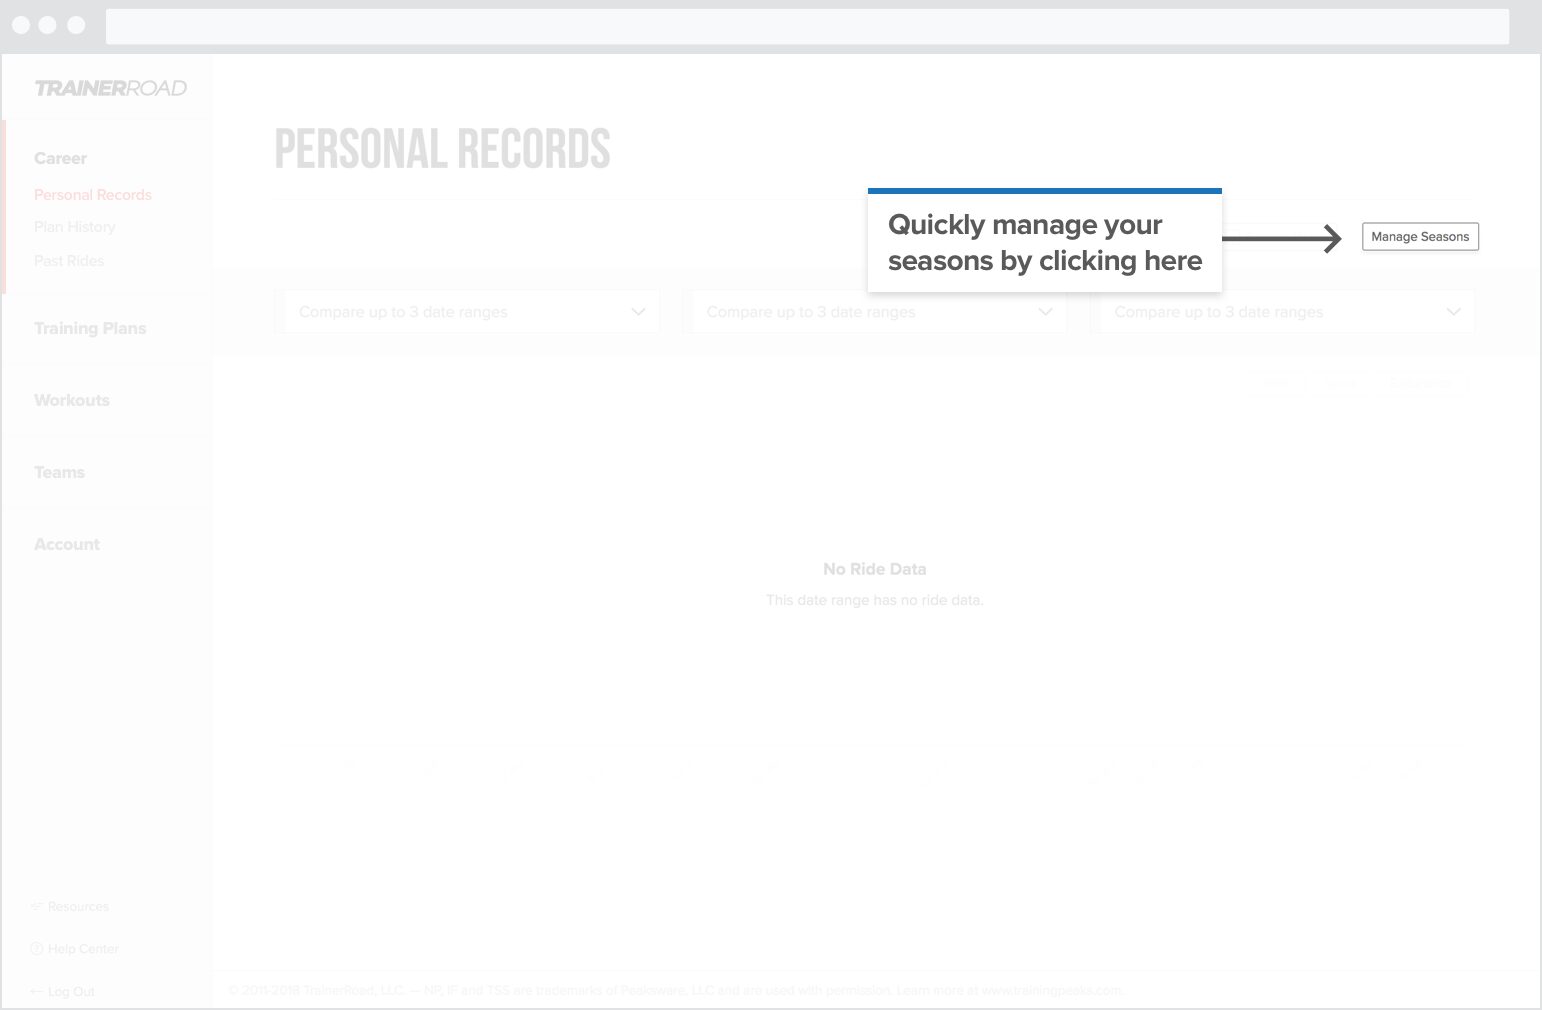
You can quickly add your seasons by clicking on “Manage Seasons” on the new Personal Record page.
You can then compare power PRs for one season compared to another.
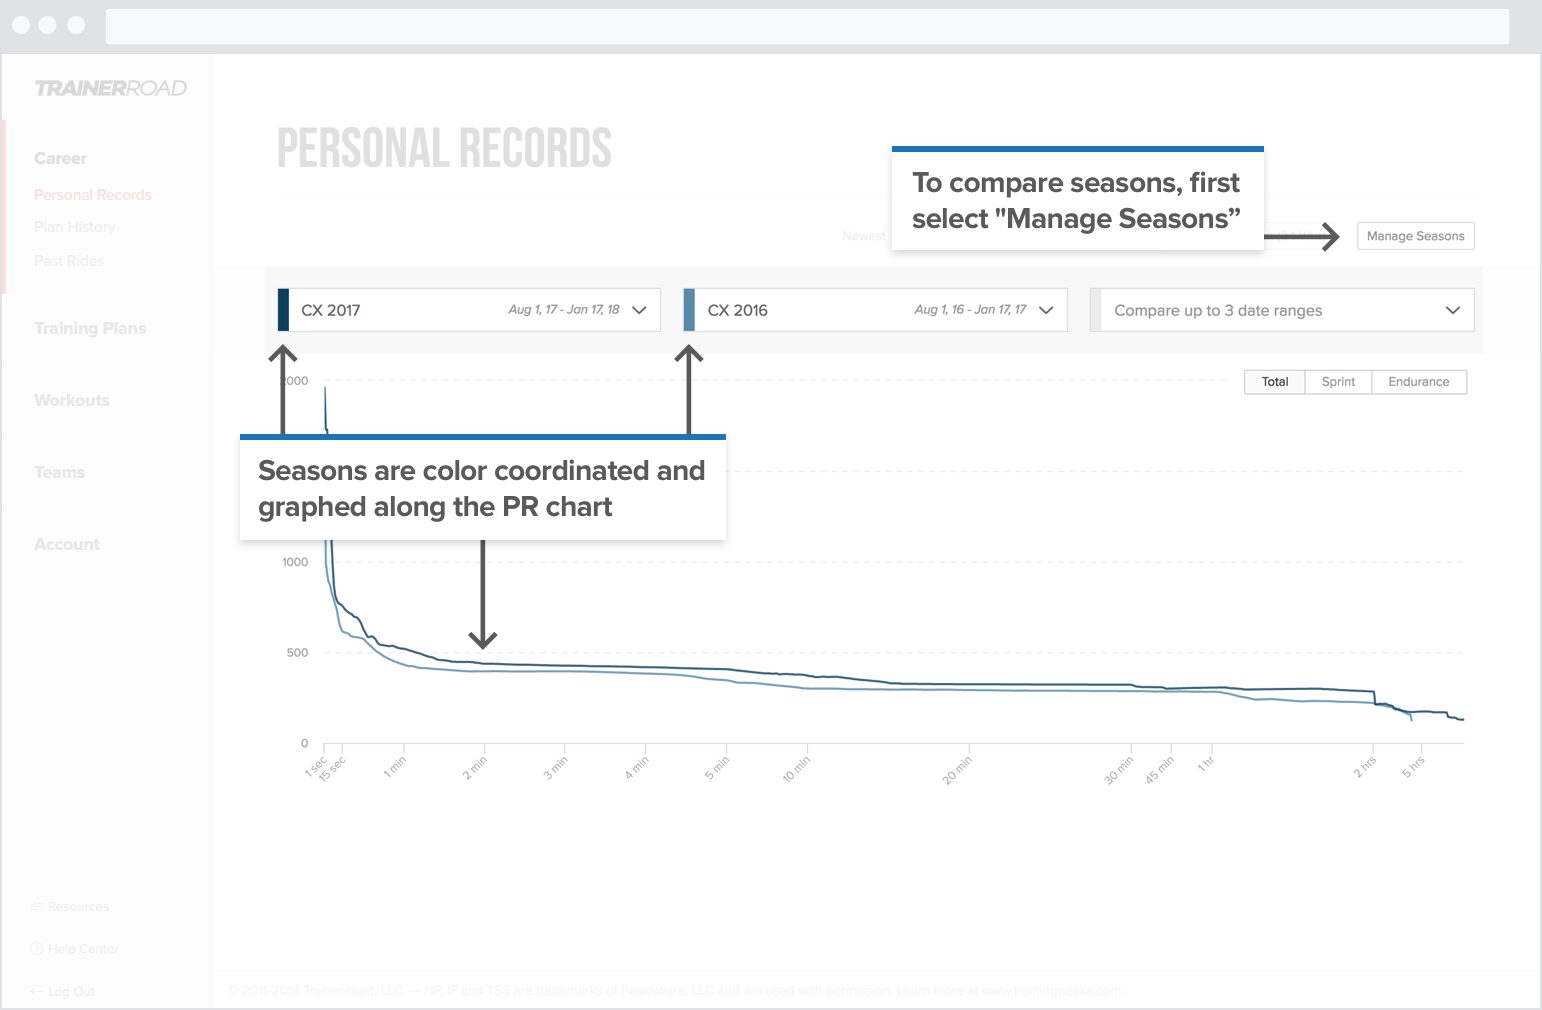
In the image below I’m comparing my Cyclocross 2017 season to my Cyclocross 2016 season. You can see that I’ve considerably increased my power in two ranges; 30 seconds to 2 minutes and 5 minutes to about 45 minutes.
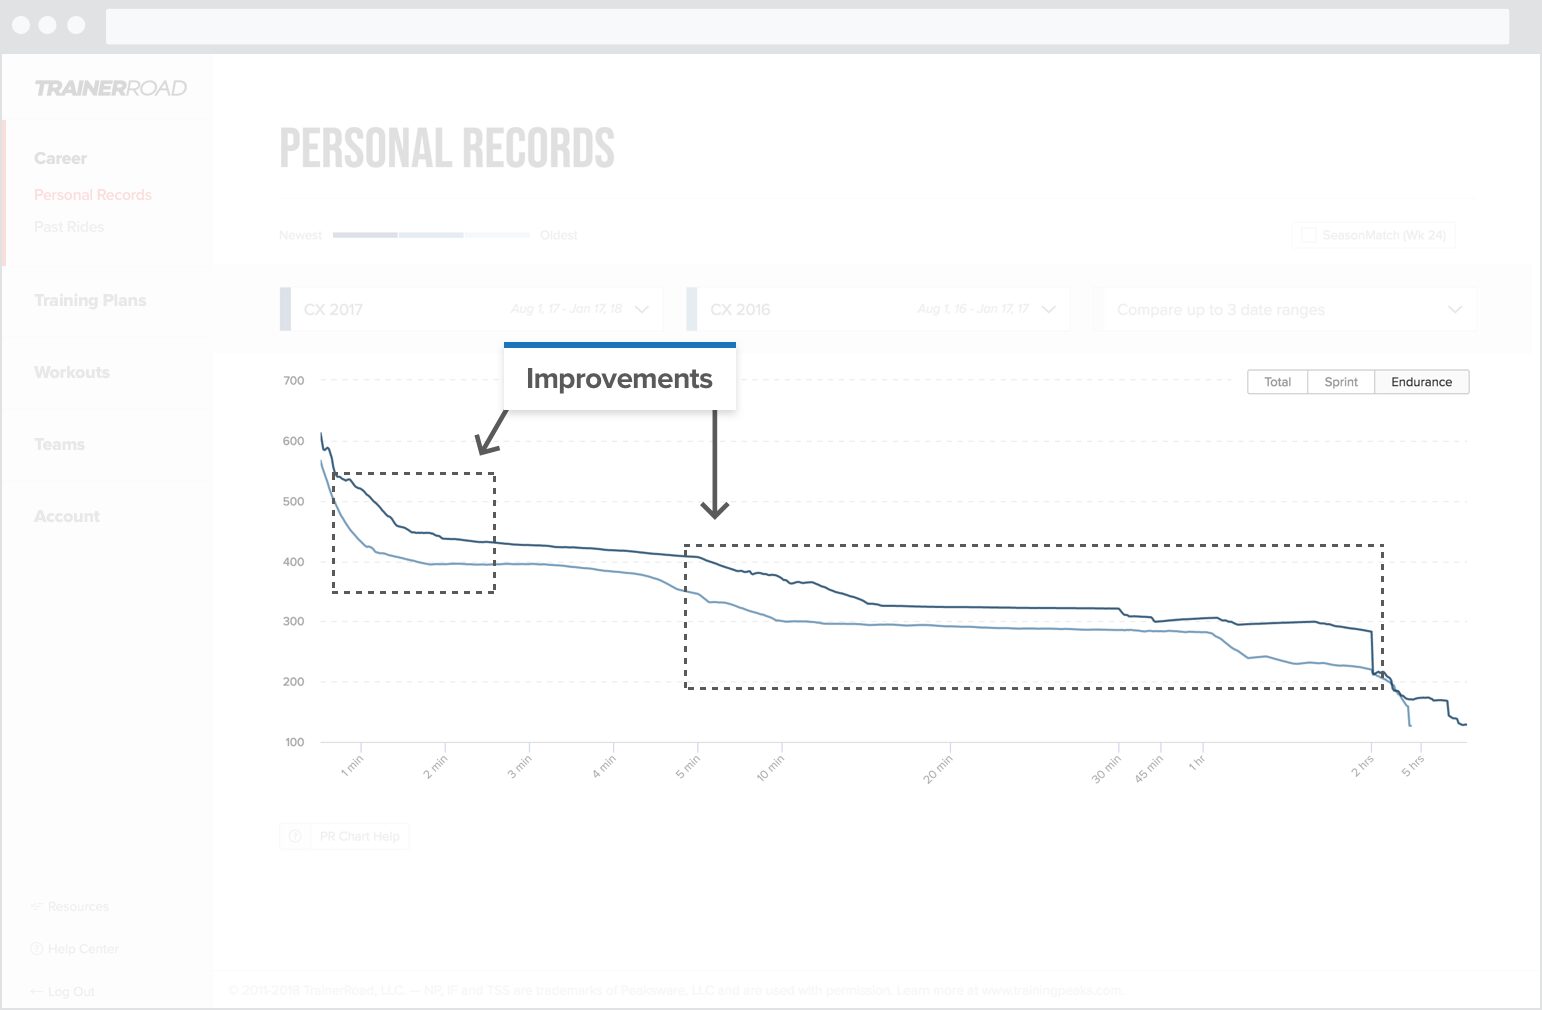
My most significant power increase came at 8 minutes with a 63-watt improvement!
One area where I could have improved more is in my 2 to 5-minute power. This reflects my training as I decided to skip my Speciality Phase Cyclocross Plan and start over with base to work towards next season. While looking at this chart, I wonder if that was the right choice.
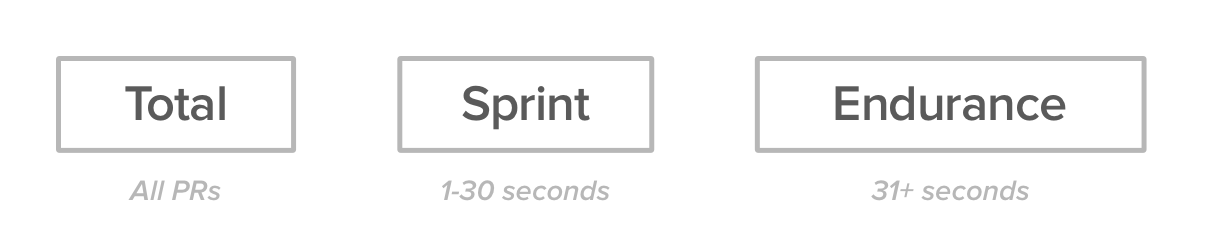
Total vs. Sprint vs. Endurance
One problem with existing personal record charts is that they show a very large scale on the y-axis. This can go well over 1000 watts for some riders which leave very little space to visualize 10- to 20-watt improvements at longer durations.
We’ve fixed this problem by doing the obvious: have a view to track your sprint power and another view to track your endurance power.
This makes it really easy to see meaningful improvements that would often get lost if we tracked all of your PRs on one graph.
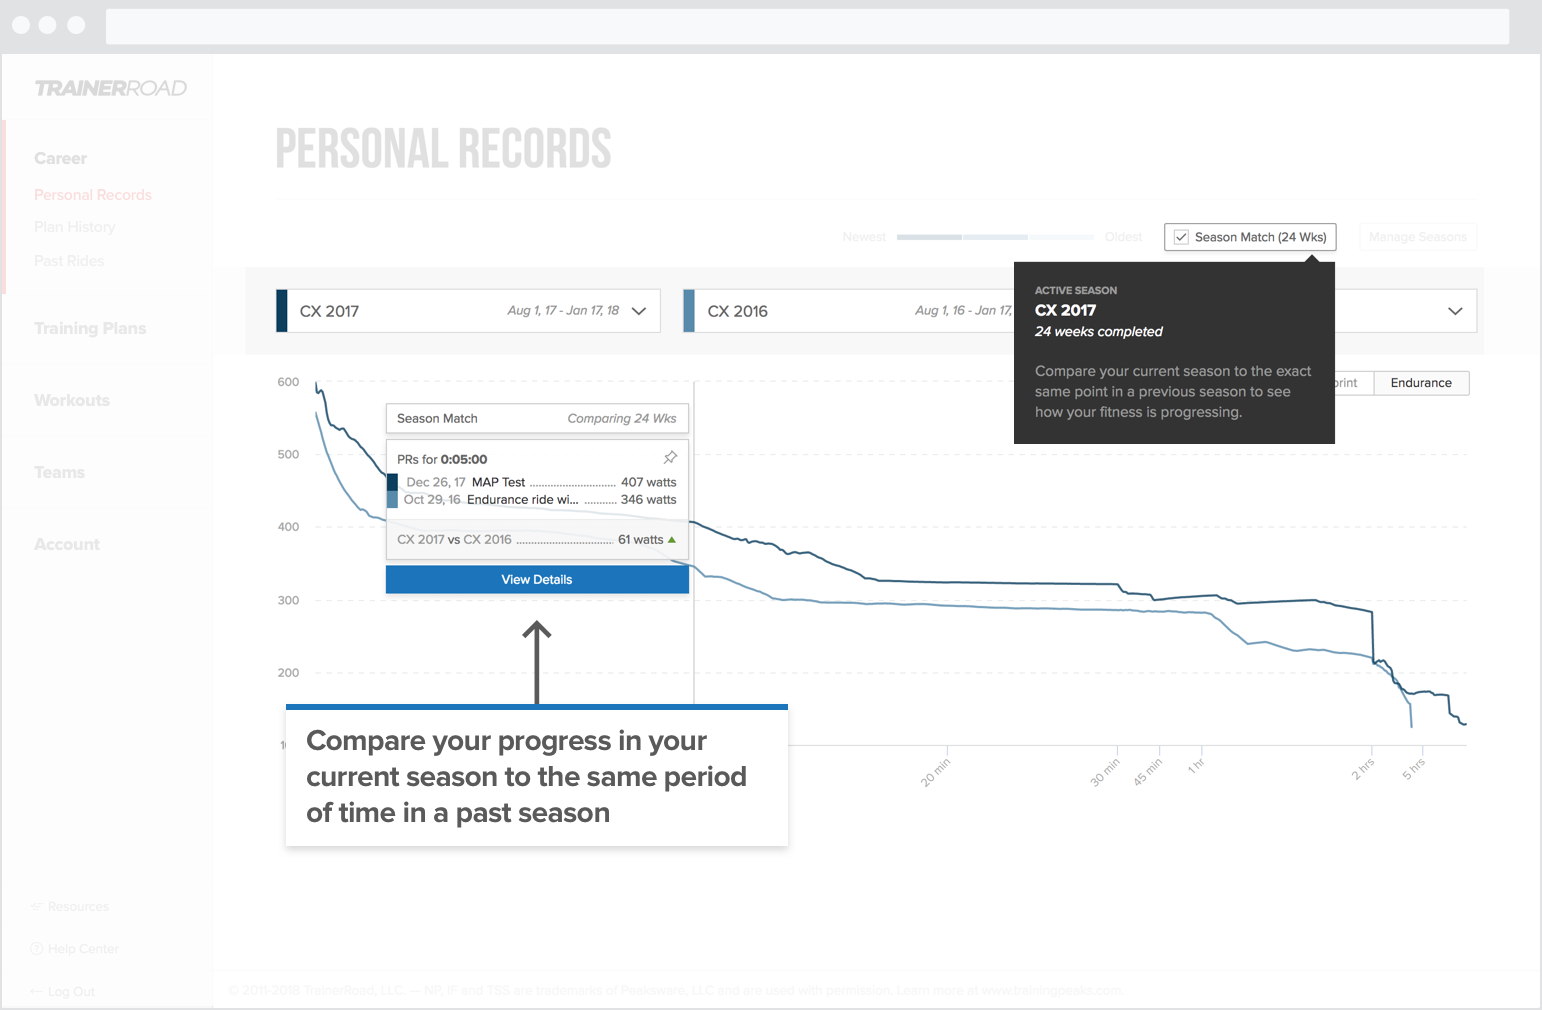
SeasonMatch
Your power PRs will most likely come in your A races during a season. The problem is when you compare one season to another you might not hit those peak power numbers until your next A race.
SeasonMatch is here to fix that.
When you turn on SeasonMatch you can compare the same period of time in your current season to the same period of time in a past season.
This means that I can compare my specific power PRs that I achieved 3 weeks into this year’s road season to last year’s road season.
With SeasonMatch I can have the confidence in my training that I’m stronger at this point this year compared to the same point last year.
And this doesn’t have to be yearly comparisons. You can compare a Spring MTB season with a Fall ‘Cross season.
Earning Personal Records per Season
Getting PR feedback is really motivating. Every time I produce more power I get a little win that I can take back and know that my training is working.
We’re now calculating PRs per Season. That means that if your ride produced the most power at 5 minutes for an active season you’re in you’ll get a new PR! This is shown on the updated ride page and on our fancy new career page.
More PRs to Earn
We’ve also expanded our PRs to be per second up to 5 minutes then slightly larger buckets after that. That means you’ll more accurately track your PRs and you’ll get a ton more of them!
It’s really a fun way to train and I’ve enjoyed earning power PRs during my active seasons.
Refreshed Career Page
We’ve also changed our PR page to show just what you need. You can quickly see your important stats (power, weight, power-to-weight).
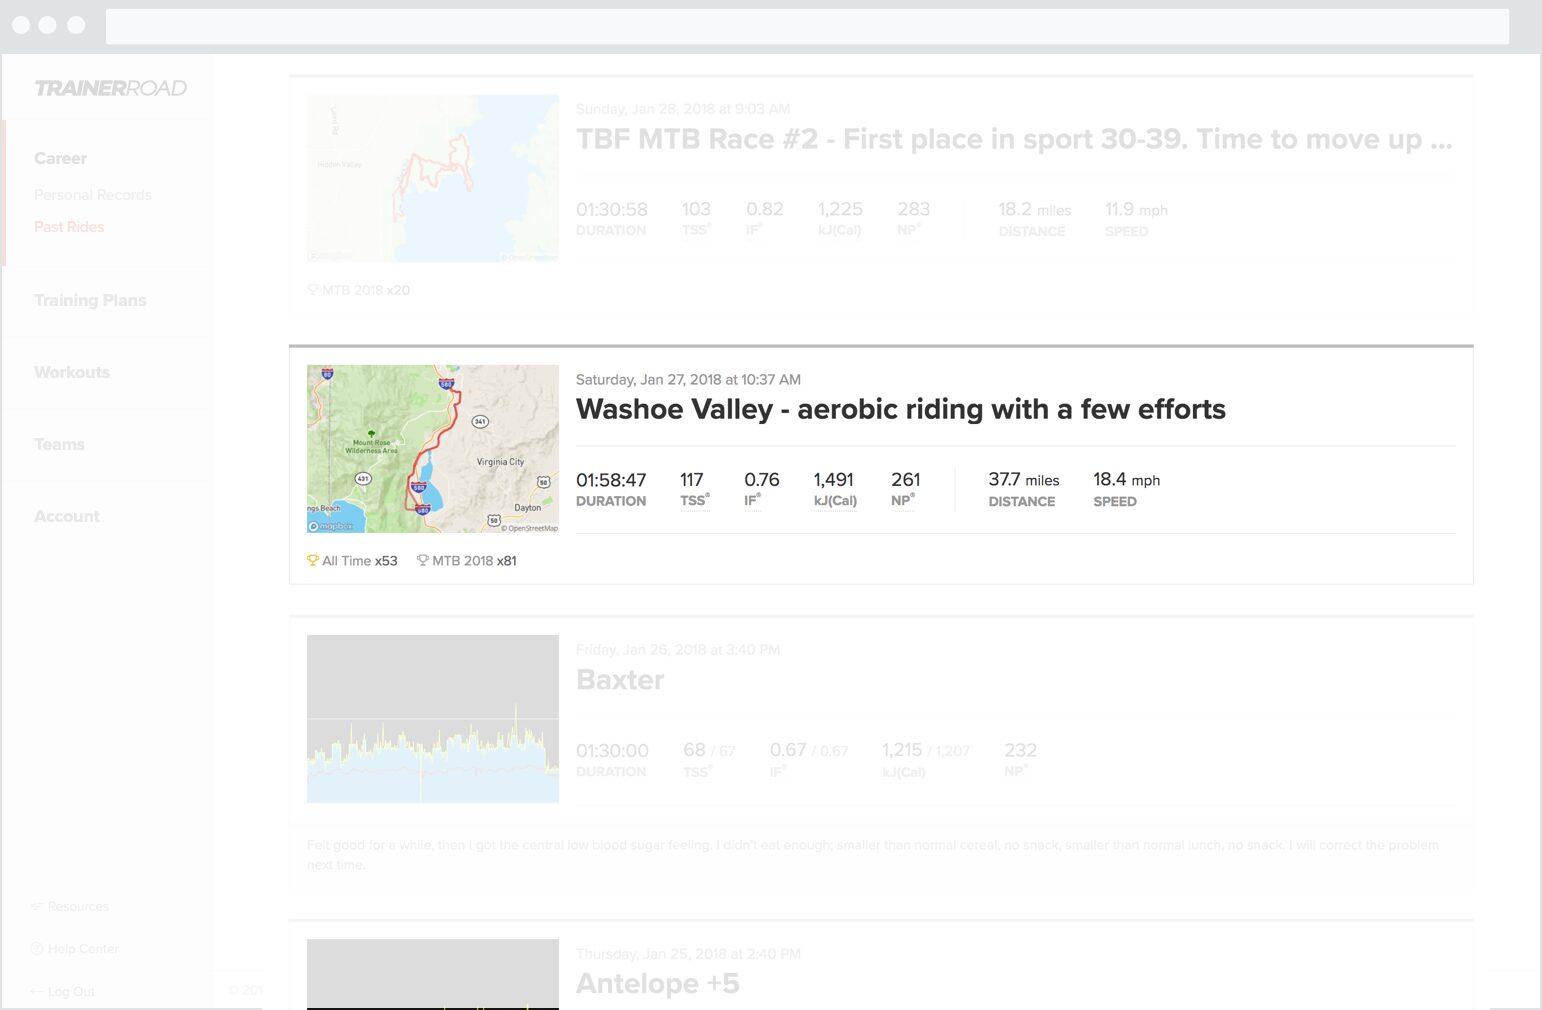
Your last ride is always front and center along with any power PRs you earned. This makes it really easy drill into the last ride you did.
The upgraded Training Stress Chart is also present on this page. You can quickly navigate to past rides and see how consistent your training (and quality) have been.
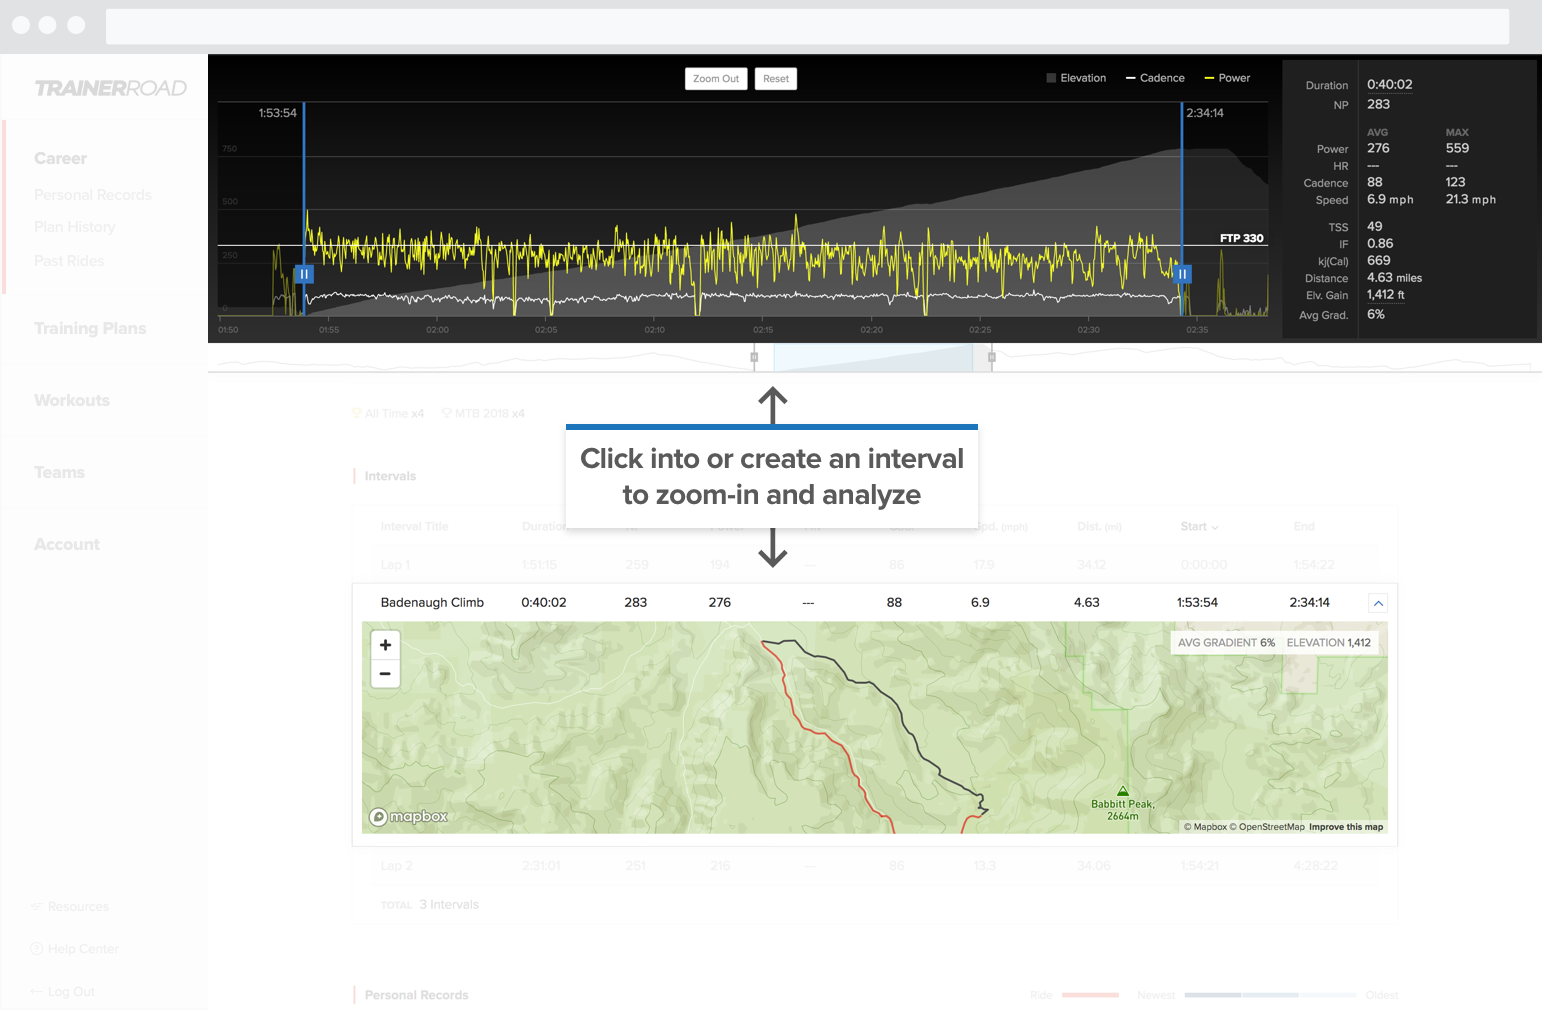
All New Ride Details Page
You can now drill in, create custom intervals and analyze your rides right on the TrainerRoad website. There’s too much in there for this post but I suggest you go in there and play with it. You can also check out some short videos on YouTube that for a quick overview.
We’re really proud of it and I think you’ll get a lot of value out of it.
Assign Outside Rides to a Plan
Of course, you can now assign an outside ride to a plan! You’ll get credit for the Training Stress and be able to review the actual ride that replaced an inside workout.
Don’t have a power meter?
We know that a lot of people don’t have a power meter for outdoor training or don’t have a power meter on every bike.
We’ve got you covered!
If you do an outside ride without a power meter there will be a banner on your ride page.
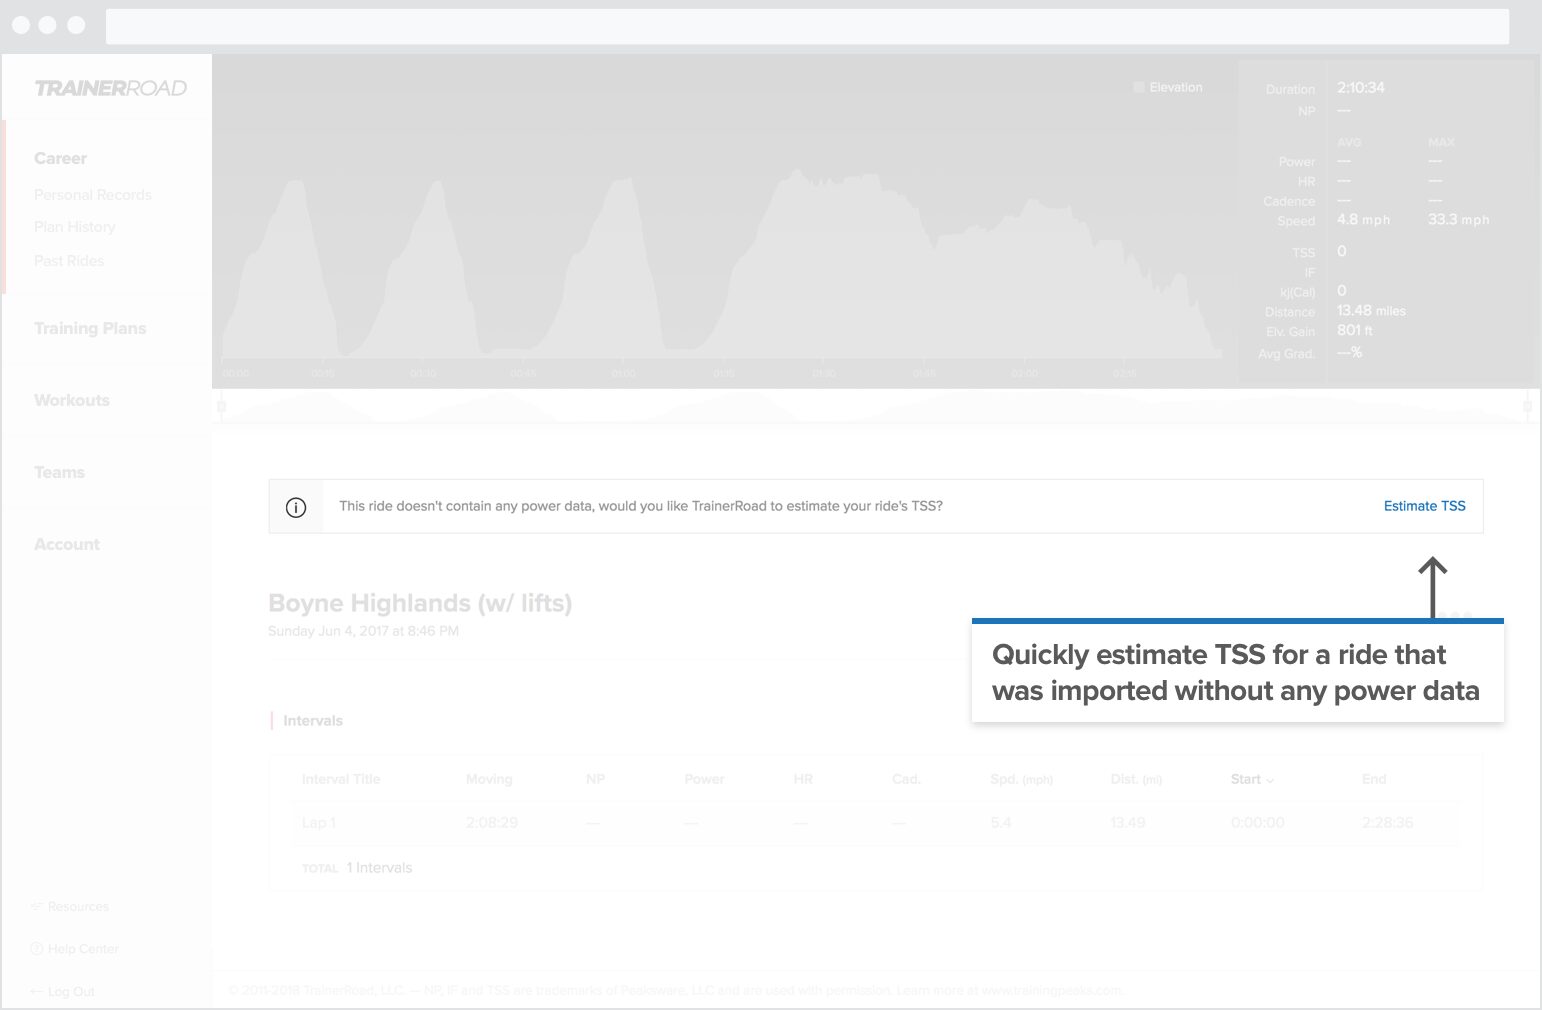
If you click on that you can tell us the rough intensity you road at and we’ll estimate your Training Stress. If you’re an advanced user you can also type in your Training Stress.
It’s not perfectly precise and it doesn’t replace a power meter. We’ve tested this feature with numerous riders at different fitness levels and we’ve found the numbers to line up pretty well.
We think it’s close enough to shape your Training Stress Chart and know if you’re on track to hit your personal goals.
How much is this going to cost?
I’ve always said that TrainerRoad is the best value for money you can spend in cycling. If someone else can find something is where they can get faster while spending less money please let me know.
We’re adding a ton of value with Today’s launch. We’ve moved from a training platform to a training and analytics platform.
Even though we’ve made TrainerRoad significantly better, it’s the same $12/month or $99/year as before. While we will someday raise our price that day is not today! 😀
If you appreciate this and think our new Performance Analytics platform is cool, please share it with your friends. Sharing will help the next set of features we want to build come out faster.
Bugs, Comments, and Requests
We’ve done a lot of testing on this, but all new products have bugs :(. If you run into any, please email support@trainerroad.com, and we’ll work to fix them.
If you have any feedback or requests, please comment on this blog post. The TrainerRoad team will be monitoring it (including me), and we’ll respond to everything we can.
We hope you enjoy using our new Performance Analytics platform and that it will make you faster cyclists!
Happy Training!
FAQ
Can I set an indoor and outdoor FTP?
We don’t believe in having a different FTP for indoor and outdoor workouts, but we won’t prevent you from doing this either.
You can manually edit the FTP for each outside ride that comes on that ride’s page. There’s a 3-dot menu at the top of the ride page that lets you set the FTP for that specific ride.
Do you guys plan to do a PMC?
Not in the form you’re probably thinking of. We’ve got our own thoughts on the topic, and they are on the roadmap to implement.
Does the Training Stress Chart replace a calendar?
Nope! A badass calendar is next on the roadmap.
What about power metric X, Y, Z?
We’ve worked hard to refine our power metrics to show you what the most important ones are and eliminate the more ephemeral ones.
There’s a TON more we COULD show you, but we’ve made a conscious decision not to show them to reduce complexity.
If you want ALL the metrics, we suggest you use some other platforms like TrainingPeaks or Cycling Analytics.
That being said, if we missed something super important, please comment on this blog post.
Learn More About Performance Analytics
For more information on each feature of Performance Analytics, learn more on our YouTube Playlist and Help Center: