So this vendor said my “Sustained Mitochondrial Aerobic Respiration Training” zone is 114-120.
So AeT may be closer to 114 than 120?
So this vendor said my “Sustained Mitochondrial Aerobic Respiration Training” zone is 114-120.
So AeT may be closer to 114 than 120?
I feel like if you follow this test to change your training, the chance of it helping you is equal to the chance of it not helping you. Just my gut feeling I guess but who knows.
Given inherent measurement variability (and knowing how physiology works), all I see is an exponentially increase in lactate, with no distinct “thresholds”.
Usually the analysis is done Lactate vs Power.
This graph is Lactate vs Heartrate. I’m not sure if the inflexion points are still valid. You can still use the raw lactate number, or the +1 from base etc…
Just found this new graphic in the report. Does this indicate anything decisive? FYI – test was run on a wahoo kickr in ERG mode. I’m pretty sure lactate is mmol/L as reported below.
I just watched a video where Alex Richardson discusses a few points around lactate testing and the importance of a precise full protocol: don’t forget nutrition around the test, fatigue, and cadence during the test.

Just adding more data to the thread.
I haven’t been on my trainer for a while, so I decided to perform a little lactate testing to see where threshold is. Rather than doing a graded test, I decided to try something different. With some guidance from CP as my upper limit, I started at about 95% of CP for 15 minutes, then I rode at CP for another 15 minutes, and based on feeling (and lactate measurements), I backed down another few watts and rode for 30 minutes to see if lactate would stabilize.
I ended up riding an average of 100% MLSS (or FTP or CP) for an hour. It wasn’t that hard and I could have gone another 10-15% longer if I had the motivation. The ache in my chest was annoyingly noticeable the last 10 minutes of the effort.
I’d round my threshold estimated to about 220 for use.
| Threshold | Source | Power | W/kg | W’/FRC |
|---|---|---|---|---|
| CP | GC (ExtCP) | 219 | 2.64 | 19.9 |
| FTP | WKO (??) | 222 | 2.67 | 15.2 |
| MLSS | Lactate | 217 | 2.61 | N/A |
| Sample | Elapsed | Feeling? | Interval | Bla | Power | HR | %MLSS |
|---|---|---|---|---|---|---|---|
| 1 | 0 | Not Motivated | 0 | 1.4 | 0 | – | - |
| 2 | 10 | Easy | 10 | 1.3 | 125 | 114 | 58% |
| 3 | 20 | Easy | 10 | 1.2 | 125 | 114 | 58% |
| 4 | 27 | Warming Up | 7 | 2.7 | 210 | 139 | 97% |
| 5 | 35 | Almost There | 8 | 3.0 | 210 | 145 | 97% |
| 6 | 42 | Too High | 7 | 4.0 | 222 | 149 | 102% |
| 7 | 50 | Too High | 8 | 4.8 | 222 | 152 | 102% |
| 8 | 60 | Just Right | 10 | 4.7 | 217 | 152 | 100% |
| 9 | 70 | Just Right | 10 | 4.5 | 217 | 152 | 100% |
| 10 | 80 | Just Right/Done | 10 | 4.7 | 217 | 152 | 100% |
Originally posted in the running thread but thought it might be better placed here…
Any insight or feedback is appreciated.
I like that paper. Their criteria for MLSS is a bit too fuzzy for me, though. And I wish they did longer than 30 minutes.
RPE is such a good indicator for intensity and is pretty much always accurate, in my experience.
It’s a wonder why establishing threshold is so difficult for many people when you can just ride to feel and find it.
Like it or not, that’s the standard criteria for the determination of MLSS.
But, yes, I agree with you. As I always tell critics of FTP, it existed long before I put that tag on it.
I tested more between about 75-92% of CP out of curiosity to see if there was much difference in lactate behavior in that range. At 75% of CP, I’m just above LT1. For the most part, all of the intensities look very similar. Even up to 92% I see a drop in lactate after I warm up.
Not much else to say about the data other than it’s normalized to the lactate reading after a 10 minute warmup at 100 watts.
| Avg Pwr | Avg HR | %CP | %MLSSHR | %MaxHR |
|---|---|---|---|---|
| 217 | 152 | 100% | 100% | 88% |
| 199 | 136 | 92% | 89% | 79% |
| 188 | 135 | 87% | 89% | 78% |
| 178 | 129 | 82% | 85% | 75% |
| 171 | 125 | 79% | 82% | 73% |
| 165 | 123 | 76% | 81% | 72% |
| 163 | 122 | 75% | 80% | 71% |
Seems like an awful lot of effort (and sore fingers!) just to confirm what’s textbook-level knowledge?
(BTW, if you continue exercising for several hours to the point of fatigue/task failure, there is often a terminal rise in lactate. This is due in part to catecholamine-mediated stimulation of glycogenolysis in non-contracting muscle, in an apparent attempt to provide more gluconeogenic substrate to the liver. It is therefore of course smaller when ingesting carbohydrate throughout exercise, but is often still noticable, at least when drawing arterial or venous blood samples.)
Well, for one, my lactate data isn’t in those textbooks (just some samples of our species) and the sore fingers are very temporary. I dont plan to do this testing again until my fitness changes dramatically.
Second, I see idealized lactate data presented many times and the charts only go to 30 minutes and not 60.
Next, I wanted to see if “sweetspot” as a concept was identifiable in data.
Lastly, I wanted to explore how constant-rate tests compare to graded tests for lactate values since graded tests are very sensitive to several parameters.
I like to make observations even if I expect the outcome 100%. I only have an engineering background, so yes, I am performing undergrad-level experiments to help my understanding of exercise physiology. ![]()
And thank you for mentioning the terminal rise in lactate after several house of exercise. That’s something I’m also curious about and wanting to observe in myself.
Suit yourself. You could save a lot of time and money (not to mention sore fingers) by just doing a bit reading, though.
ETA: Is there some reason that you didn’t test at an even higher power? 4 mmol/L is rather low for MLSS when cycling.
Thanks, and I will!
Time and money are things I’m very fortunate to have and I read quite a bit. I get bored of reading and like to practice, so here we are.
Also, just picked up the 4th edition of Texbook of Work Physiology, so my nightstand is getting full again.
Yes, there was a reason. I really didn’t want to push that hard and I was more interested in trying to feel a very particular sensation that I feel on the road when my NP is over a certain wattage.
I also wanted to start doing sweetspot training so it was important for me to test within the range I would be doing the bulk of my training.
I’ve done a lot of testing from 15 seconds to 10 minutes to failure, so I wanted to look at a different area, physiologically
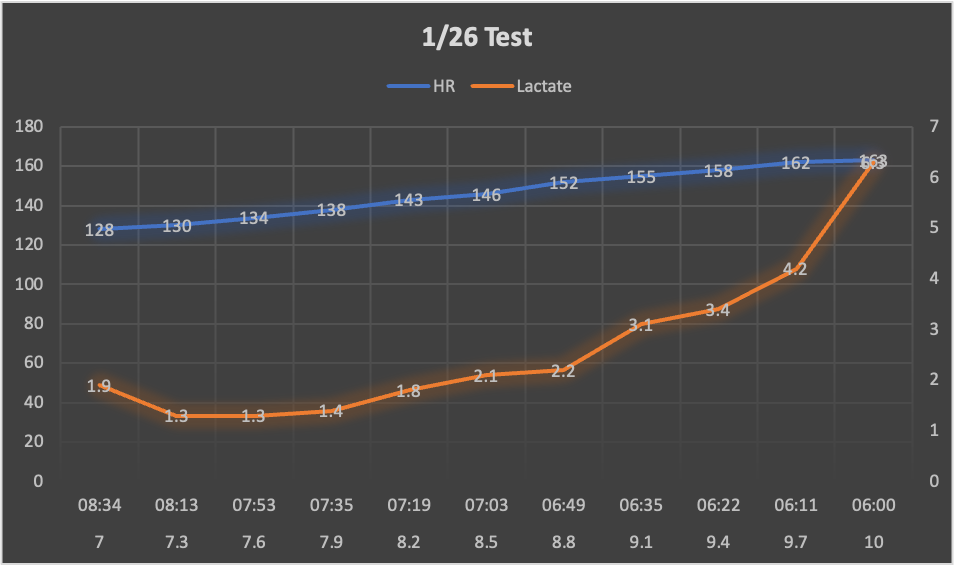
Completed another test today and looking for some feedback on how to interpret the results.
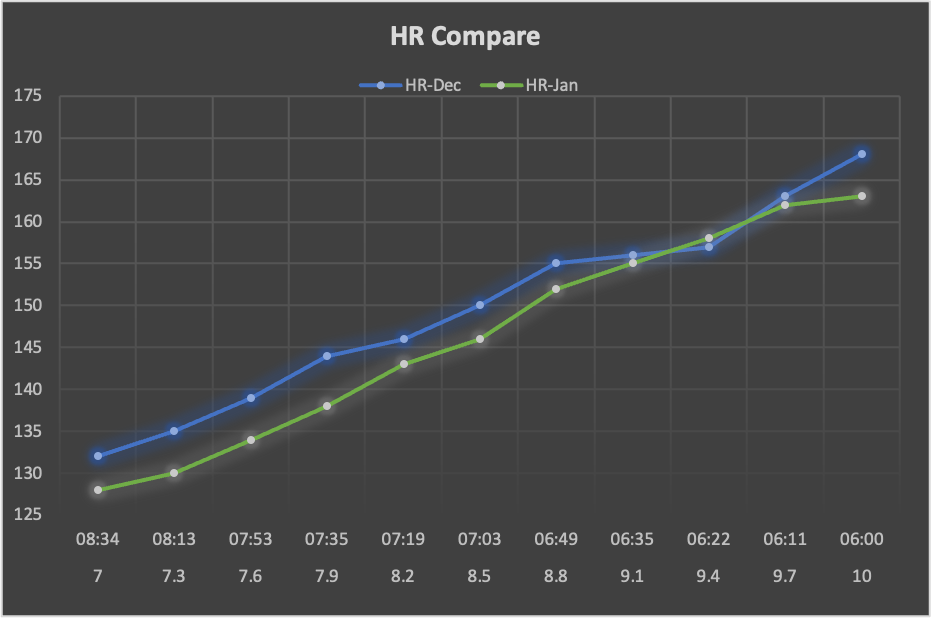
For reference here was the last test in early December.
Today’s results
For the purpose of comparison I created two separate charts graphing the lactate and HR readings separately.
I can see my HR has improved from one test to another. Meaning, lower HR for the same paces, however the lactate appears to have gone up for the same paces. I would have assumed the lactate readings to have lowered.
Based on my initial test I estimated my LT1 and LT2 at 139 (7:53 min/mi) and 157 (6:22 min/mi), respectively. With the change/increase am I reading the results correctly in calculating the new values at 138 (7:35 min/mi) and 152 (6:49 min/mi).
Apologies for the long post but appreciate any insight and feedback given.
Feedback: lactate testing is like reading tea leaves in Professor Trini’s class. Unfortunately, you appear to have seen The Grim.

A bit more seriously (but not much): Baseline lactate levels are grossly elevated in the second test. Were both tests in the fasted state? Were your diet (esp. carbohydrate intake) and training comparable for 48-72 h prior to both?
Other possibilities: calibration error, expired test strips, sample contamination, lack of free flowing blood following puncture, etc.
I was not fasted for either. Both same time of morning after same/similar breakfast with same shoes. As far as training, the first test was in the middle of structured/unstructured mix of bike and run workouts. Following that test I started a few weeks of base/aerobic focused training then three weeks of speed work. This week has been a down week so much easier in terms of intensity.
The strips are/were brand new and I had very few, next to no, issues with drawing blood the time around… So maybe calibration as you noted.
Appreciate the second set of eyes.