Are there plans to surface Critical Power/W Prime to athletes in the software?
Hey @StabbingQTip ![]() I don’t think so, but I can ask/make it a feature request!
I don’t think so, but I can ask/make it a feature request!
@StabbingQTip already done! ![]()
Well, sort of. TrainerRoad already provide your power curve. All you need to do is pick data points from that curve and use some on line critical power calculator (type in the data from your power curve and click 'calculate). You should be able to find 3 point and 5 point CP calculators on line for free.
OR you can go the extra mile and construct your own model/calculator using a quick Pubmed search and a spreadsheet.
I doubt TR will ever implement it when there’s much better things for them to spend their resources on (I’ve been waiting for WLv2 for something like 4 years now).
Intervals.icu makes it pretty easy to determine. Golden Cheetah can do it. I assume WKO5 can too
Yes, I was also going to recommend intervals.icu for this
Yeah I saw them. I’m looking to cut down on my training platforms though, not +1 lol
Why do you want to know CP and W’? Do you want to use them as performance metrics? Do you want to train to improve one of those metrics? Or do you want to replace FTP with something “better”?
BTW, a lot of researchers on the subject treat CP and FTP (as numbers, not concepts) interchangeably, because they are extremely close and correlate very, very strongly. Moreover, there is criticism to the CP-W’ model as such as well, because of range of validity problems (For what durations is the CP model valid?) and other models seem to fit the data better. Also the paper that @Brennus linked to finishes with the following conclusion (emphasis mine):
Overall, I don’t think it’s practically worth going down this direction for practitioners of structured training (≠ researchers from sports sciences).
If I had to bet money, I think TR will introduce something like AI FTP to detect other suitable zones so that it bases its VO2max intervals at, say, 118 % or 125 % FTP rather than 120 %.
If the right people do the data analysis, I reckon you could get a much better statistical model out of it than what individual researchers can do. If N is small, you are really limited in the number of parameters you can include in your models. CP has two parameters, for instance, and they struggle to get something statistically viable. TR isn’t limited to such simple models due to their huge data pool. But that may be at the expense of a model that’s easy to understand in terms of a handful of parameters, and these parameters have a very simply interpretation.
CP and FTP are conceptually the same. If you read Dr Coggan’s 7 deadly sins, critical power testing is one of them. Why? Because FTP is just a naming convention. A field testing method to estimate mlss.
There is no such thing as an FTP model. They are all critical power models with fitting parameters renamed. Even critical power is a naming scheme for curve fitting parameters.
And why would someone want to know their critical power? At least with one of the 15+ critical power models you can find online can be audited for assumptions, etc. AIFTP (CP in a trench coat) is a black box with no quick way to inspect why the values are the values being produced.
Same reason WKO5 model is weak from an auditing perspective. It’s derivative of existing models and appears to just combine a CP model with a logarithmic decay after TTE so it fits the data better.
Your study sample size has no real bearing on your CP model fit. Classic 2 parameter is two fitting parameters to MMP data. 3parameter adds Pmax.
WKO5 model has 4 parameters, FTP (CP), FRC (W’), Pmax, and TTE. golden Cheetas ExtendedCP model has 8 fitting parameters! But recent OmPD models have 4 parameters and many of the published models vary from 3-6 parameters.
That’s why I feel TR and WKO should publish their models for auditing. In the engineering world, all my software has Technical and Theory manuals to clearly explain the assumptions and equations. This is $20k/year software and they tell you exactly how things work.
No, you misunderstood that bit, I was referring to justifying the validity of CP models: the larger the number of athletes size, the clearer the evidence that the power-duration curve follows one of the CP models — or not. So in this sense, study size does matter and a huge data pool like the one TR is sitting on has any sports science study beat.
These models are validated with studies. If N is small, then you cannot necessarily expect to be able to predict the values of all parameters with sufficient accuracy.
That issue also arises if you apply a particular model to a single athlete: if they don’t have enough all-out efforts in the relevant range of the power-duration curve, you cannot reliably predict the parameter values as the statistics are too bad.
Both issues can make a model with more parameters less useful.
That’s problem for WKO, if it is based on a simple physiological model. Speaking for the semiconductor industry, also here some of the models are published as it is necessary for them to be known so that different tools (= machines) from very different manufacturers can work well together.
The only reason why I hesitate is that any discussion of what FTP really is can lead to a death spiral of circular posts.
I agree that CP and FTP have the same basic aim and therefore must arrive at very similar numbers. Differences can easily be due to the different test protocols.
I agree with the first sentence, but not with the second. To me FTP is defined as MLSS measured in a field test, and strictly speaking, numbers are only comparable if you keep the test protocol the same.
CP arises out of a 2±parameter model for the power-duration curve, assuming it is given by a particular equation (with 2+ parameters).
Can you share where ExtendedCP and WKO model validation papers are? Most studies I see are kinda nebulous from the start for 2p and 3p models.
This is also a bit backwards. The MMP data is being fit with a curve. You can apply any model to MMP data. Whether the model fit is appropriate and parameters are reasonable is the question. And then, once you fit the data, you have to try to reconcile the data fit with physiological relevance.
And that’s why care has to be taken to provide the model the appropriate data. AIFTP likely has the same problems as other models.
Fun stuff.
No, I don’t. Do you? (Honestly asking, not being snarky or argumentative.)
Yes, and you can statistically fit any curve to data — even if they two look nothing alike. This is a classic example taken from Tamara Munzner’s book on Visualization Analysis & Design:
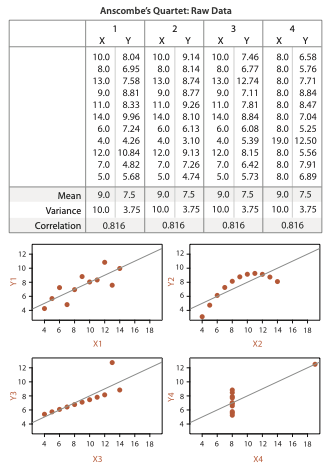
All of the different data have the same mean, standard deviation and correlation, i. e. the same fit to Y = a X + b. ![]()
So when I wrote “the power-duration curve follows one of the CP models — or not”, I was thinking of the example on the top-right as a counter example. In the U Lboro paper I linked to earlier, at least with the data that they used, simple power law models were better fits to the data.
AI FTP has different problems, me thinks, because it is a ML-based model based on a huge pool of training data. So you have very different issues compared to lab tests (invalid data due to unreliable power meters, heart rate monitors, different measurement devices for different (and often the same) athletes, etc.). The parameters are determined with techniques that are very different from classical statistical methods even though statistical methods are crucial for making ML work.
More classical statistical models would likely use parameters with a specific meaning (like CP or W’) that has an easy definition and interpretation. With ML-based models the parameters don’t generally have any simple interpretation.
Although we can debate the perfect model of concepts similar to CP and W’, I think Er should get back to the original topic: being able to determine those in TR software.
And the natural question for @StabbingQTip is what would you use that information for? How would it be useful information and how would you alter your training or racing based on it?
For sake of this discussion, we can assume that TR would say their AIFTP = CP. There’s no point in debating that IMO because you either accept that or you wouldn’t use TR’s estimate of CP as your CP and would use another tool instead.
So how would W’ (W prime) be used? Well, it is most simply thought of as anaerobic capacity. So it’s basically measuring how many ‘matches’ one has the capability of burning above threshold. So it could be used to better determine one’s Progression Levels for the above threshold zones. Maybe TR already does something similar to W’ today for that.
As far as racing, a live W’ balance field would in fact be useful for some people in deciding how hard to push in a breakaway for example. But, even that application is limited because the model will never be perfect and fitness, especially above threshold, does in fact vary day to day and is heavily influenced by glycogen levels, stress, fatigue, etc. So it’s best to race by feel. Although some people, like me, could use a bit of objective metrics to calibrate their feel for it. I think there’s a Connect IQ field for W’ on Garmin devices. I’m using a Wahoo though.
So that’s the long version of why I don’t think TR would add CP and W’. I believe TR already applies similar metrics to your training plans. And the vast majority of users don’t really know of or understand them. So KISS.
You could also use the spreadsheet I shared over at Intervals forum. There are 10 of the more popular models, mostly CP, that you can fit to your data. You can manipulate the fitting parameters for each model to see how the parameter changes the curve shape. I needed a way to quickly visualize small changes in MMP and their effect on the PDC and downstream modeled parameters like VO2max, VLaMax, and other correlations. You can use as few as 4 strategically placed data points to get reasonable fit.
My sheet is very basic and does a minimization on the sum of squares of the difference between the MMP and fitted curve points. There are far more elegant ways to fit the data, but I was keeping it simple. I show model residuals, too.

In the end, even with as much time as I spend analyzing data and doing metabolic testing at home, I do it for fun. If I want to really find threshold, I go for a run or ride to feeling.