This can cut down your processing time, sure, but beware of premature optimization. Depending on the use case, it’s not really slow.
The naive approach on my system, using Pandas, takes about half a second for a one-hour fit file to compute the full power curve.
pd = [ data['power'].rolling(d).mean().max() for d in range(len(data)) ]
Sure, but the full-resolution PD curve for a particular workout is going to be just as long as one of the data series (which you already have 3+ of) for that workout, no?
Yes but it needs to be stored in Postgresql and I wanted to keep the db size down for easy backups. Also if someone wants to see the power curve for the season you need to query all of those rides and for every time point pick the best power. Maybe full res would have been ok but I figured I didn’t need that anyway.
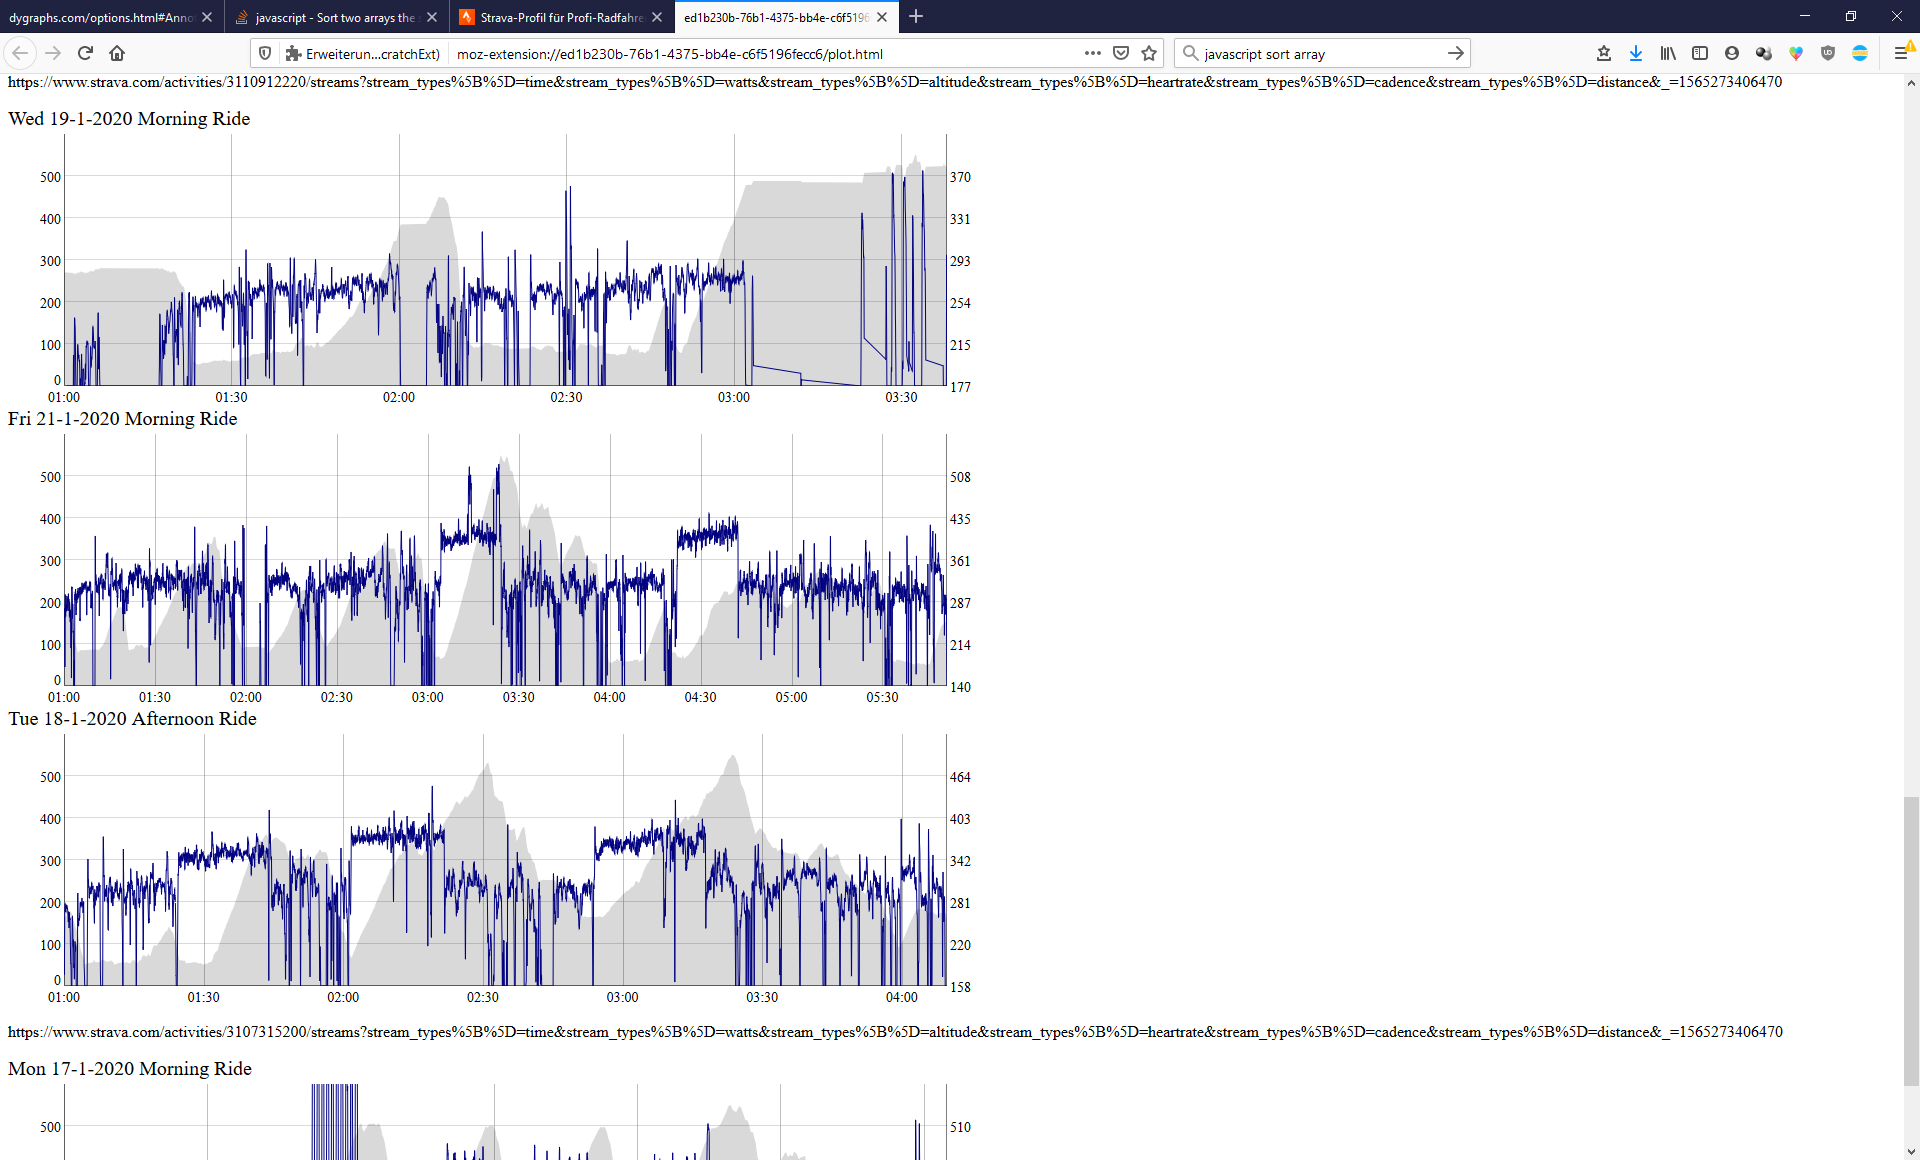
slowly, veyl slowly I’m getting somewhere with porting my python Strava hack to a web extension. But how cumbersome is this, coding a webextension is so unpleasant. All those restrictions. I have tried 10 charting libraries and all of them wouldn’t work because of some security issue. Ufff …
My 2 cents is light on the cycling science and is geared more towards the tools -
Give Jupyter Notebooks a look if you have time. They provide a great platform for prototyping, learning and exploring with Python.
Its also worth taking some time at the beginning to go over the Python coding style best practices, outlined by PEP 8. Conforming to these standardized best practices will pay dividends down the road and make the journey less frustrating.
Flake8 is a great resource - “linter” - to help you adhere to these best practices.
Hoping someone can help me fix an annoying problem. So I save my fit file using FileField and it works fine to save under its own model. I had been sending Ride Summary stats into another model. But I was trying to get them under the same model, but the problem is the filefield generates a null value (because it’s only a file being saved) and get that it violates not-null constraint. Curious if there’s a way to return anything other than a null value?
Seems like there are quite a few coding cycling nerds out there. I’ve pretty much done the same as @hubcyclist, faffing around with python and cycling data for my own geeky pleasure. Currently working towards two objectives : my own bespoke monthly stats package (peak 3 minute power, peak 5 minute power, number of intervals per power / hr zone etc). Also trying to create something similar to BestBikeSplit to help me plan longer rides.
My approach is a bit different - downloading datafiles from Strava/Garmin, and pulling them all into a consistent CSV/Excell’able format, adding some calculated data (including power estimations and so forth) and then manipulating the results in Excel (because Excel is so damn flexible).
A lot of my code is not fit for human consumption yet, but here is a repository with code that reads GPX/Fit/TCX files and save them in a consistent CSV format, tested on Strava and Garmin files. There might be some value in some of the code to someone, and being able to play with the data in excel is quite useful for me.
If there is some interest in this and maybe some more straightforward analytics (Golden Cheetah is great but oh so complex) message me on github …
I really like Golden Cheetah, but there is only one thing about it that I find quite annoying: When I am travelling (for example for training or racing) and only have my phone/ipad with me I cannot access any metrics. I especially wanted to see what CTL, ATL and Form is after each ride. So I used tapariik to download the fit files, wrote some hacky python code to read them and extract these metrics and was wondering what the best way is to make this accessible to my phone/tablet without having to pay for a server.
Then I discovered intervals.icu which just syncs the files from strava, and provides these values and a bit more, so I am more than happy with it!
Lots of interesting stuff here. I’m wondering if I can process my FIT/TCX files with Python, push the data to Prometheus Gateway, and then use Grafana to create pretty dashboards
Having all my data in Prometheus is appealing.
Just sharing something I found on the plotly forum (also golden cheetah google group). This guy is using plotly dash and put together a pretty slick looking app.
As for me, I’m working on putting together my app’s PMC. One thing I’m thinking about is how to have the PMC read different FTPs based on date. I know Strava’s issue is that their PMC is based on a single FTP input. Conceptually seems easy enough but not sure how easy the coding will be to match up ride date to an FTP which corresponds to that point in time
Look at how it works in Trainer Road, Elevate, or Golden Cheetah. There is a sequence of (date, FTP) pairs. Metrics for a ride are computed using the entry with the latest date that is earlier than the ride date. That’s easy enough to do in a cooked system (like SQL), but it’s also easy with, say, a sorted Python list and bisect. Sometimes there’s a “default” FTP or special entry to cover the time span before the first real entry. Note that if you’re storing computed metrics, adding/removing/modifying an entry at date B in between dates A and C requires recomputing metrics for all rides with B <= ride date < C.
There’s also the intervals.icu approach, where every single ride stores the FTP used to compute its metrics. The value set for “your FTP” is what is set for a newly-added ride. Then, you provide a range-edit tool (“change the FTP for all rides from date A to date B to X”).
is figure out how to create seed CTL, ATL, and TSB so I don’t have load all my data retroactively. I can add a row of seed data manually but the calculation as written in the link doesn’t take this into account so I get something goofy like this
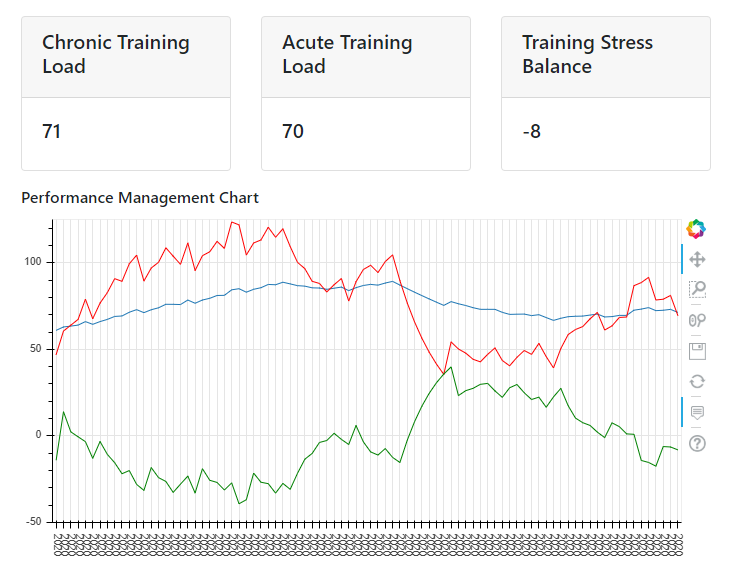
On the positive side, I figured out how to feed current day’s CTL, ATL and TSB into the template, but my data is a bit off and also it’s not something that will dynamically adjust with each day, it’s just pulling from a database record. But it’s a start, and the PMC chart is there too. So technically I now have a functional PMC website lol In practice it needs a lot of work (for example, I haven’t done anything to automatically download strava rides)
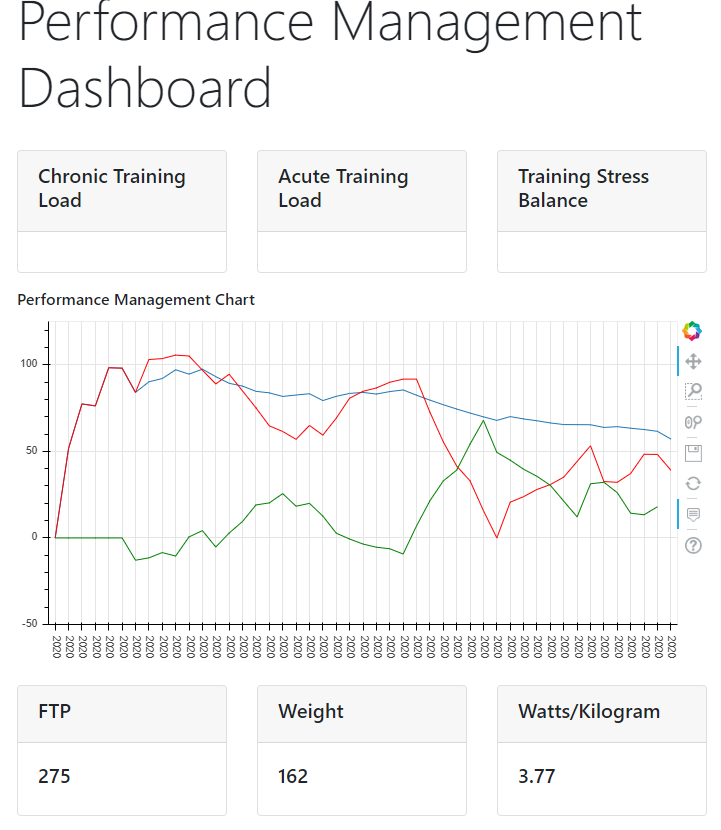
Not sure how many folks are still interested but I’m making some progress with my PMC site, just making little tweaks before I tackle the bigger project of the self adjusting PMC (I am only slightly aware of cronjobs but not up to speed in doing them).
Added current FTP/weight/wkg to front page dashboard
added multiple FTP entries and ability to edit them (did the same with weight), still haven’t done anything to get a ride file to select the right FTP based on the ride date/ftp at that time, but it’ll get there:
Found a cool add-on called django-background-tasks so I’ve got my strava token refreshing every 6 hours and I have a very rough start to auto-refreshing PMC
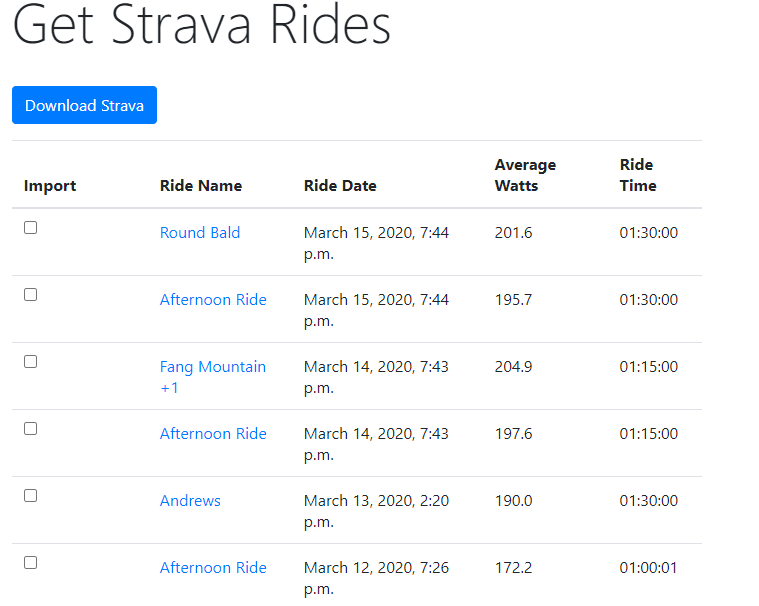
I’ve also got the following page going to import strava rides into django (I can already mass import with python but I’m working on getting rides on an individual basis with this form). Right now I’m just pulling a list of recent rides and some summary, don’t have the code to extract the individual rides yet
I’m now able to select and extract individual rides based on what was checkmarked, took a while but I got there! Right now I’m extracting to csv or json as a trial so the rides aren’t going into any analysis or PMC yet, I need to figure out how to make strava imports play nicely with fit file imports.
As a newbie to this, it can be overwhelming trying to sift through info online, stackoverflow always comes up first but it’s a chore trying to find the thing that applies to my situation and the times I’ve posted so far have resulted in zero responses. I guess it just helps my problem solving skills to piece it together on my own! lol
So I managed to be able to incorporate both strava and fit files into a summary database used to create a PMC. The other challenge I had to overcome was that the PMC I was using above had a different formula for CTL and ATL, as a rolling average of tss, which isn’t quite right. Doing it the proper way, taking into account prior values was tough with my rudimentary knowledge, and my solution is likely a total bodge, but it’s working lol I also wanted to have some sort of initial seed data to provide so that my chart wasn’t starting at 0, so that was something I was trying to work though and think I managed to do, but I guess the next step is incorporate it into Django to allow an end-user to edit this to their liking.
Just went very deep into a rabbit hole reading through all this… Some awesome stuff here. Love reading through your process, and definitely keep updating. From what I can see you have not kept up with the github though? Looks pretty naked over here compared to what you have made progress on here.
My background is in Mechanical Engineering and Exercise Science, and I currently use pretty rudimentary Python at work analyzing metabolic and biomechanical data of athletes (mostly runners), but this is fascinating to me. Please continue to update, and include links/resources you have found helpful. I read through the above and those outgoing links, and those outgoing links… It’s been an exciting night of quarentine!
hey! glad you’re digging my updates! Yeah, I’ve been pretty negligent with the github as a) I’m not very experienced with it and b) so much of my stuff is a work in progress I’m always editing stuff. Eventually I’d like to get most of the code up. I’ll definitely keep up with the posts as long as some people enjoy them, although I think from now on it’s going to just be little behind the scenes stuff vs some of the visual stuff I’ve been posting