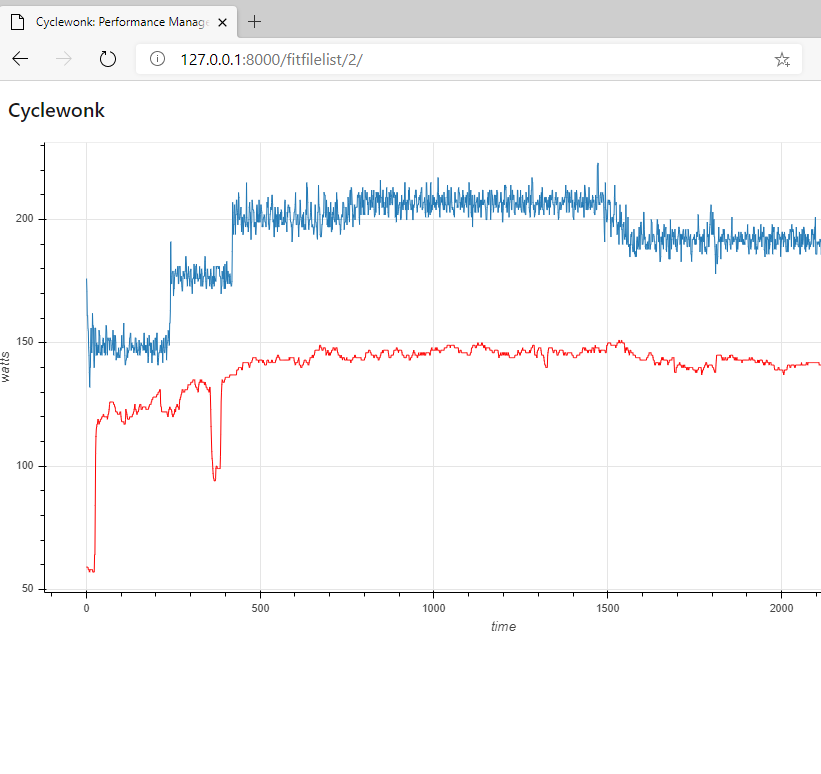
Alright, massive breakthrough day for me. So my big task was trying to leverage Django’s DetailView to just pull up a ride detail (using a Bokeh plot) based on whatever ride I clicked from a listview. Sounds like an easy task but it wasn’t for me lol
It’s probably not the most efficient at the moment since the code is reading the fit file upon clicking as opposed to pulling up a database record, but hopefully I’ll figure out how to store fit data in a way that can be used by django
I’ll try and get this onto github tomorrow. Right now the bokeh plot is as barebones as it gets, so I need to work on formatting and the ability to mouseover for data.
The Intervals.icu back-end is a simple Java Spring Boot app using Fluentjdbc to talk to Postgresql. Activity streams (for watts etc.) are stored on the filesystem and the rest in Postgresql. The front end is a single page Javascript app using Vue.js and Vuetify components and d3.js for charts. I started the project in part to learn Vue.
I’m an R user and conduct research on population health. I haven’t ventured into analysing my own or others cycling data yet but will keep an eye on this.
R, plotly (interactive data visualisations) and Shiny (creating online app for interacting with data) could be useful resources for communicating findings here.
This is interesting, just curious, is it because putting cycling data (many rows per record) would be tough to do with Postgresql? Because this is basically what I’ve had to do with my little project with fit files.
Popped in here to offer encouragement! Best way is to read and apply the concepts.
Development has been my career choice, and I’ve moved between being a dev of various forms (front, back, db, full stack, whatever you name it), a team lead, manager, and now working towards a cloud solution architect. Definitely a fun career and my calling so to speak, but between a family, cycling, and frequent work travel, I simply don’t have time outside of work hours to work on anything.
No I could have easily put that in Postgresql arrays. I just wanted to keep the size of the db under control for easier backups. Those files only change if an activity is cropped or something so they only have to be backed up once. The activity records in the db change frequently.
Hi, this looks really cool, I am doing PhD in theoretical physics and I use Python for data visualization and have some experience with plotting and data analysis. @hubcyclist what is your end goal for this? something like an open-source data analysis thing or more of a learning project?
Mainly learning, since I’m not really doing anything that we can’t already do with stuff like golden cheetah and intervals.icu but I can see this just being something open source that people can take and customize to their heart’s content
It shouldn’t be any trouble to put data sourced from a fit in a SQL database. I would guess, though, for most operations, there’s no real motivation to do that over serializing to a file in some format that’s easy to parse.
Full disclosure: I’ve applied for a React dev position at TR, waiting to hear after round two (finished one take-home challenge and one timed coding challenge, which both went great this time), but I have an awesome local job offer offer that expires Tuesday. Hoping for a miracle and some solid TR answers by tomorrow, but I understand that’s a LOT to ask of anyone, so I’m probably missing out on the TR dream, for now.
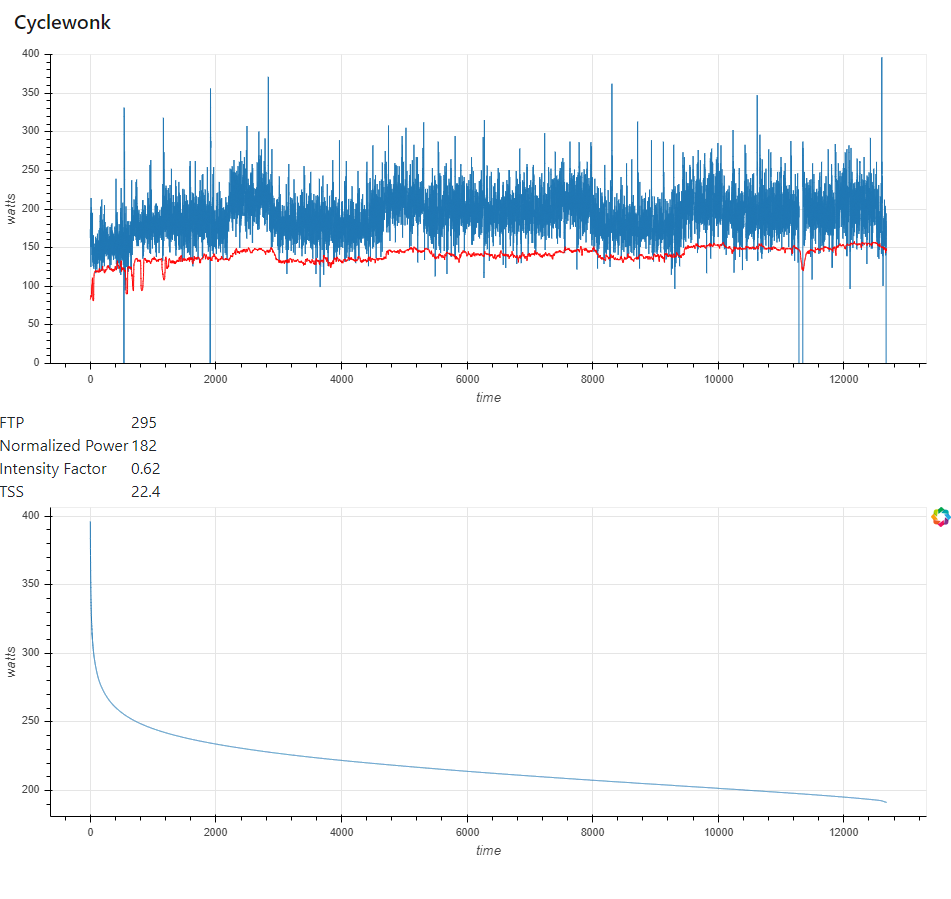
Anyway, I’ve done something similar, not sure how I missed this thread for so long! It’s all on the client side at the moment, but I went straight for the power duration curve. Anybody have ideas (or just know), how to quickly grab the PD curve given a list of the wattage data? That’s killing me. Currently, I’ve just hardcoded multiple durations and it’s not super slow. Note: this is only for Garmin .tcx files currently. I did a custom parser just for fun. It may be terrible, but it does work.
@jpowers Yeah, great question. So the way I’ve written the max average for a given duration requires checking every possible subarray in the lap. It’s just not fast enough to reliably run 3600 times for a one hour workout.
That max average function HAS to be optimizable, but I haven’t come up with how to do that, yet. I’m guessing it’s some clever data structure or other manipulation due to the fact that it’s continuous.
I actually put that comment in and then kept the previous code, as I was trying to list out the thoughts there. I was sort of working on that algorithm and then got distracted. Thanks for pointing that out, though. I’m not totally sure how I’d take that to the next step. I’ll try later today and see what I can one up with!
My issue previously with that implementation is that I could easily have a case where a maximum 61s doesn’t necessarily contain the max 60s. So I’d have to check every possibility again unless I exclude ranges. What I would think is to exclude large ranges in each subarray where a maximum value for that length subarray couldn’t exist.
You can cheat by not calculating every possible duration. For Intervals.icu I do every second until 60s, every 5s until 120s, every 10s until 5m, every 30s until 10m, every minute until 1h, then every 5m. Then I just slide a window across the data for each duration. You normally plot this with a log time scale so thats plenty enough resolution. I was mostly concerned with the storage space, not so much the time to calc (Java is very fast). With this I can compute power curves for any range of dates very quickly.
You need to interpolate the data first to 1 second steps. There are a lot of people out there using devices that have very random spacing between data points.
Exactly. Cheat by not calculating every possible interval.
And use the pandas methods that are already available. e.g.:
data['Power'].rolling(duration).mean().max()
(sorry, now I see that PD refers to power-duration and not pandas, the package @hubcyclist is using . I’ll leave the code example in my message for whoever may find it useful)