Race Analysis: Dirty Kanza 2018 with Geoff Kabush
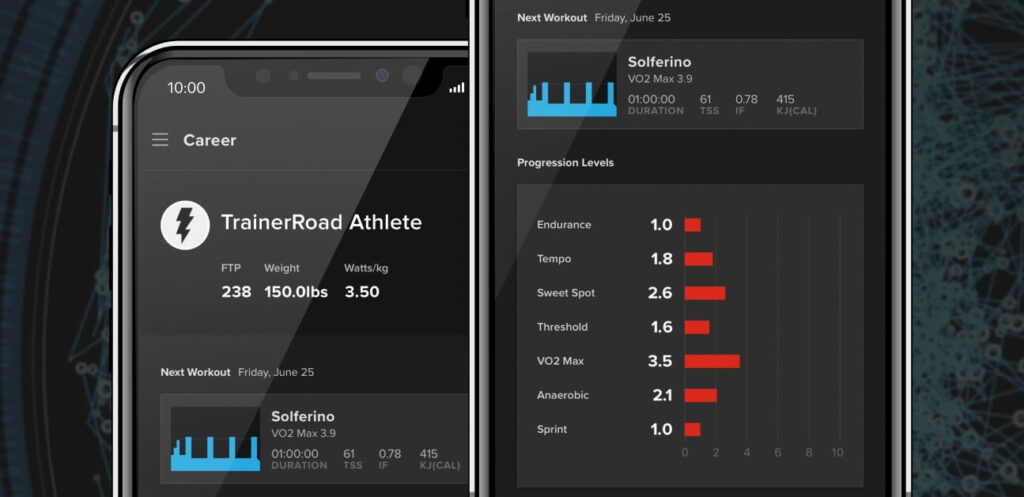
What sort of effort does it take to get third place on the fastest day in Dirty Kanza’s history? Let’s do some race and power file analysis of Geoff Kabush’s race with TrainerRoad’s new Performance Analytics features.
Dirty Kanza is one of the most popular gravel races in the world, and although there are multiple distances available to competitors, the 200 mile course is considered the premiere category. The race is known for attracting a world-class group of racers, windy conditions, constant undulations, sharp flint rock and a high risk of muddy conditions that wreak havoc on bikes.
Geoff’s Stats and Equipment
Geoff is a three-time Olympian and one of the most prolific mountain bikers in history with 15 Canadian National Championships, a World Cup XC win, 9 World Cup XC Podiums, a Pan-American Championship, two Trans Cascadia wins, a BC Bike Race title… you get the idea – this guy’s good.
Geoff is known by his competitors as a clever tactician with an uncanny ability to read races, but his years of experience at the top level of mountain biking deliver more than savvy. Geoff has the fitness to back up his tactics. As a point of reference, Geoff’s power-to-weight ratio was right around 5.5w/kg for Kanza, but as we all know, there’s more to performance than just power-to-weight, especially with such a complex day as DK.
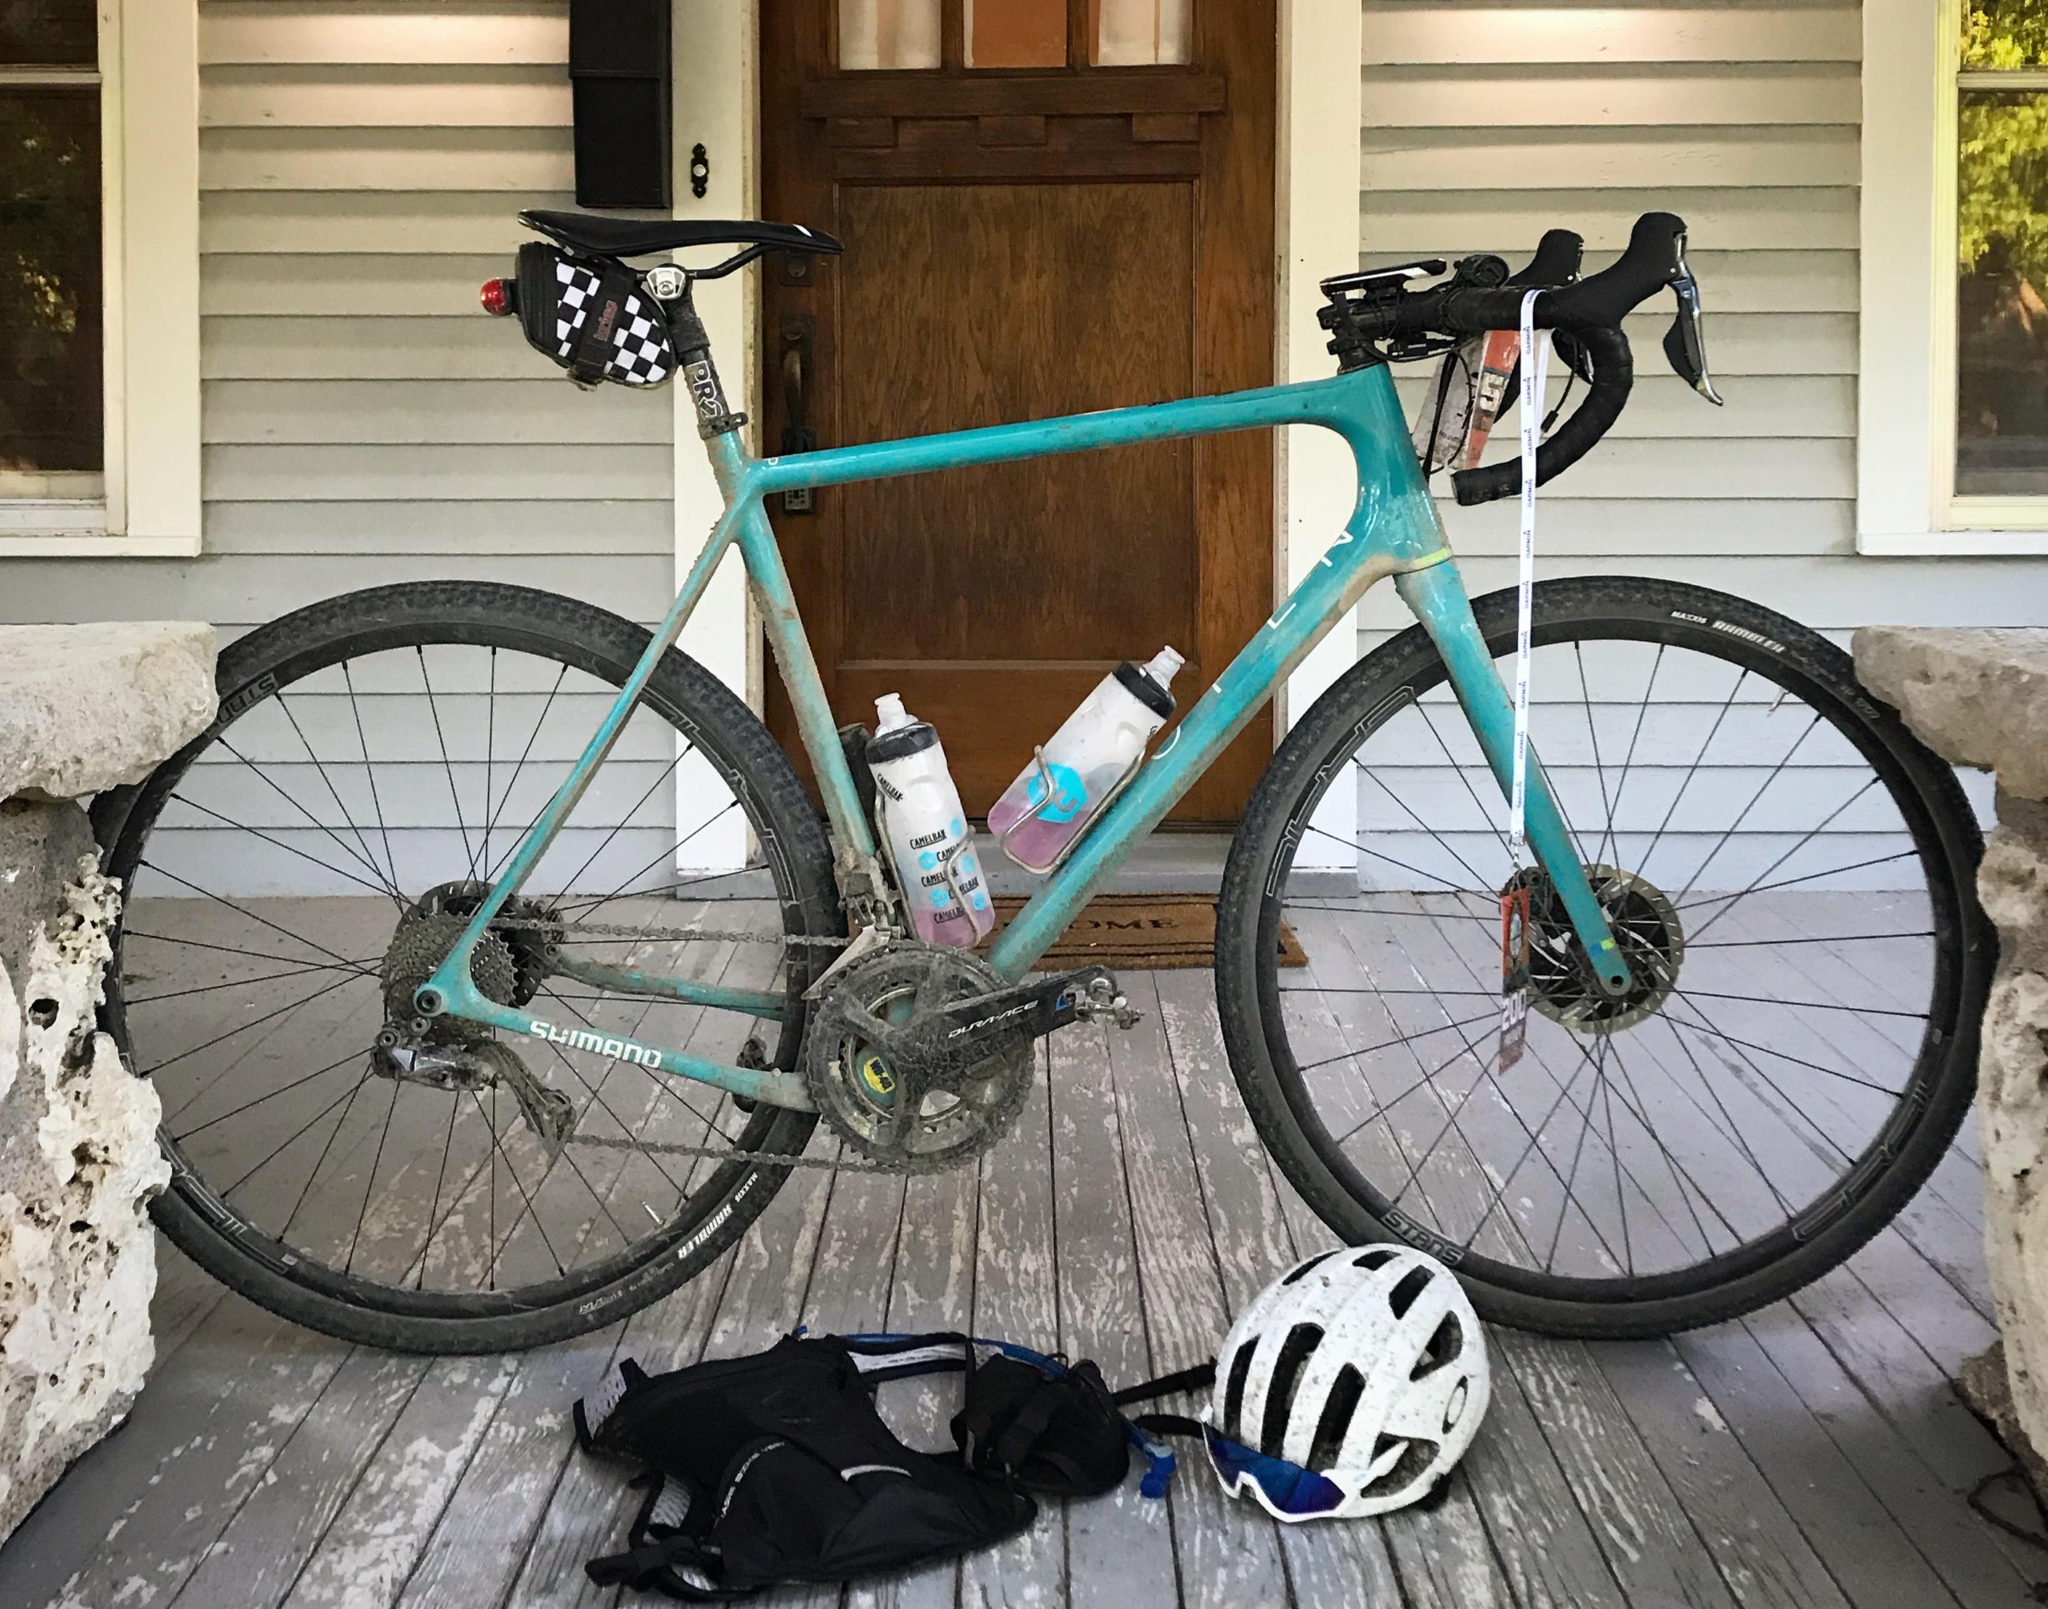
Geoff rode his Open U.P. Yeti Turq Special Edition bike (size XL) with Stans Grail CB7 wheels, 700x40c Maxxis Rambler tires with EXO protection ran tubeless and a Shimano Dura Ace Di2 drivetrain with 50/34 chainrings and an 11-30 cassette. He was using the new Stages L/R Dura Ace power meter and Stages Dash to track his data and since the race is unmarked and self-navigated, he zip-tied a battery pack to his bike to give him enough battery capacity to have navigation all the way through the finish. He famously chose not to use aerobars and even shared why in this editorial piece over on VeloNews.
Geoff handled his hydration by carrying two bottles with him at all times with GU’s Hydration mix, and a Camelbak Chase Bike Vest with GU Roctane was waiting for him at every aid station. He froze the 1.5 liter reservoirs and bottles the night before, and GU and Camelbak folks kept them chilled and ready at the aid stations for him. Having ice cold liquid really helped when the heat kicked up later in the day.
He carried GU Chews, Gels and other nutrition items that were carb dense yet easy to process. Geoff tested a top tube bag, but decided against it on race day. Top tube bags are a bit of a fashion faux pas in the cycling world, but this is gravel, so no pretense or judgement need apply – Geoff simply didn’t feel it was necessary on that day.
For spares, he was carrying a saddle bag, and for tools, he was carrying the OneUp EDC Tool / Pump Combo. The EDC tool cleverly carries a spare quick link, CO2, tire lever, chain breaker and a multitool all inside the handpump.
Leg One
48 miles, 1,844′ gain
Before the start of the race, a strong thunderstorm rolled through the area bringing muddy conditions and a 30 minute delayed start. Geoff was in the front group from the start, and for an athlete of Geoff’s ability, the pace was a relatively easy 276 watts up the gradual 500′ rise of Towers Climb.
Geoff wisely sat in for the majority of the first leg and had a Normalized Power of 252 watts when he reached the first aid station after two and a half hours of riding. Although the pace started out easy, Geoff had burned 1,900 calories already. He had a nutrition strategy of 250 grams of carbohydrate and just over 1,000 calories every two and a half to three hours. Assuming his drink mixes were mixed at their intended potency, that comes out to two and a half servings of GU Roctane in his reservoir, two bottles of GU Hydration mix, two packages of GU Chews and two GU gels every two and a half to three hours.
Leg Two
55 miles, 2/516′ gain
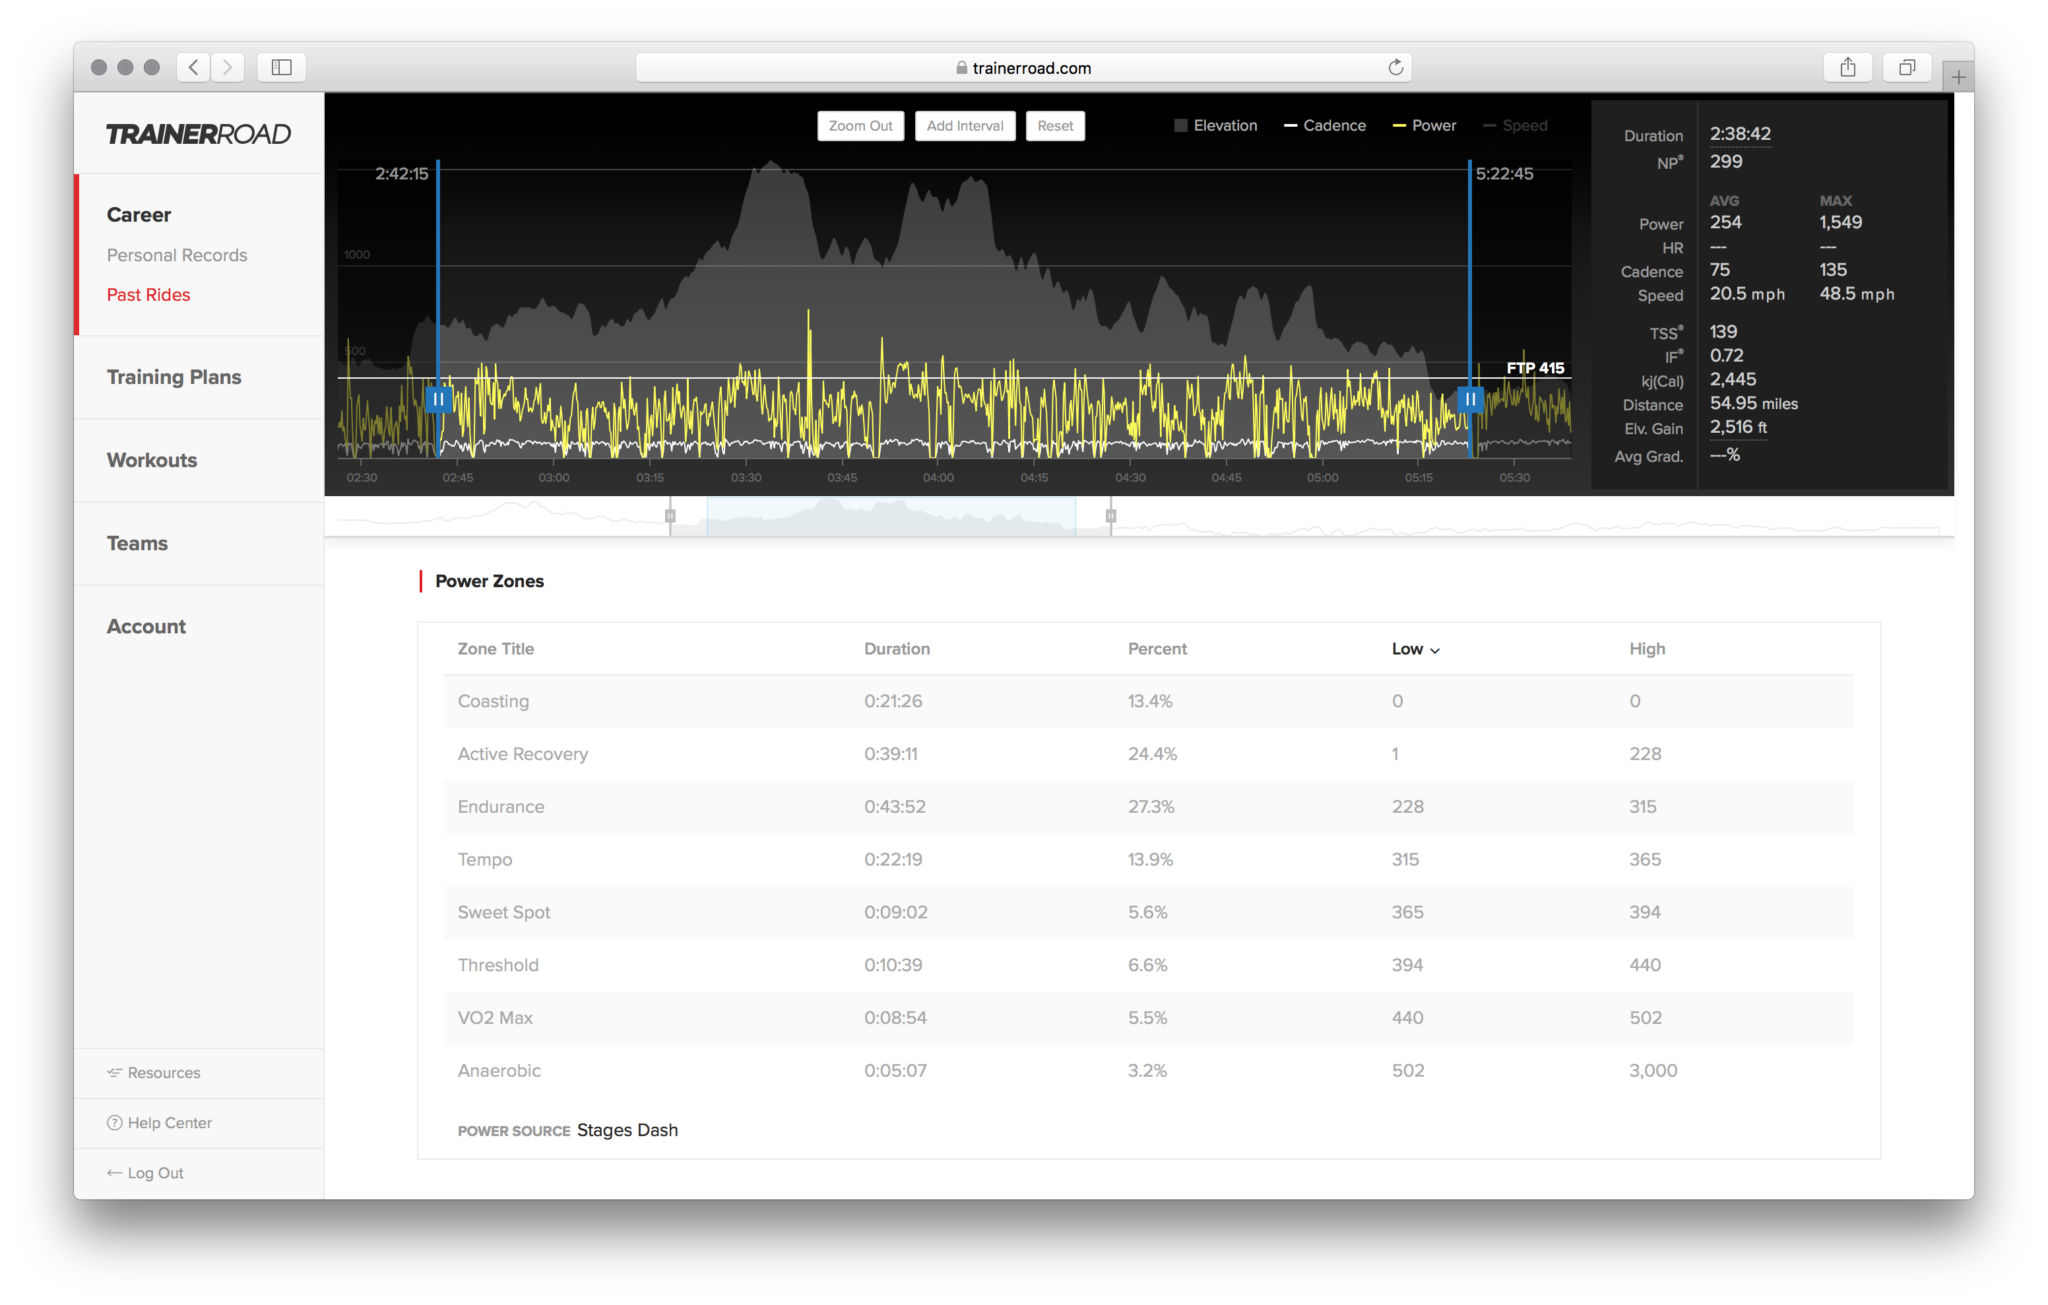
Looking at the elevation profile with our new Performance Analytics features, Leg Two looks pretty similar to Leg One, with Texaco Hill and Teter Hill serving as the two main climbs. The power data shows that Geoff worked much harder than the previous leg with a Normalized Power of 299 watts, which seems natural with the increase in climbing, but upon closer inspection you can see the climbs had very little to do with this increase.
The crushed rock surface that Dirty Kanza is known for is composed of razor sharp flint rock, and one of those rocks put a gash into Geoff’s tire. He quickly pulled over to fix the leak with a tire plug, which worked for a short while before falling out once again. The second plug seemed to do the trick as the tire was now holding air, but Geoff had to chase back to the group two separate times.
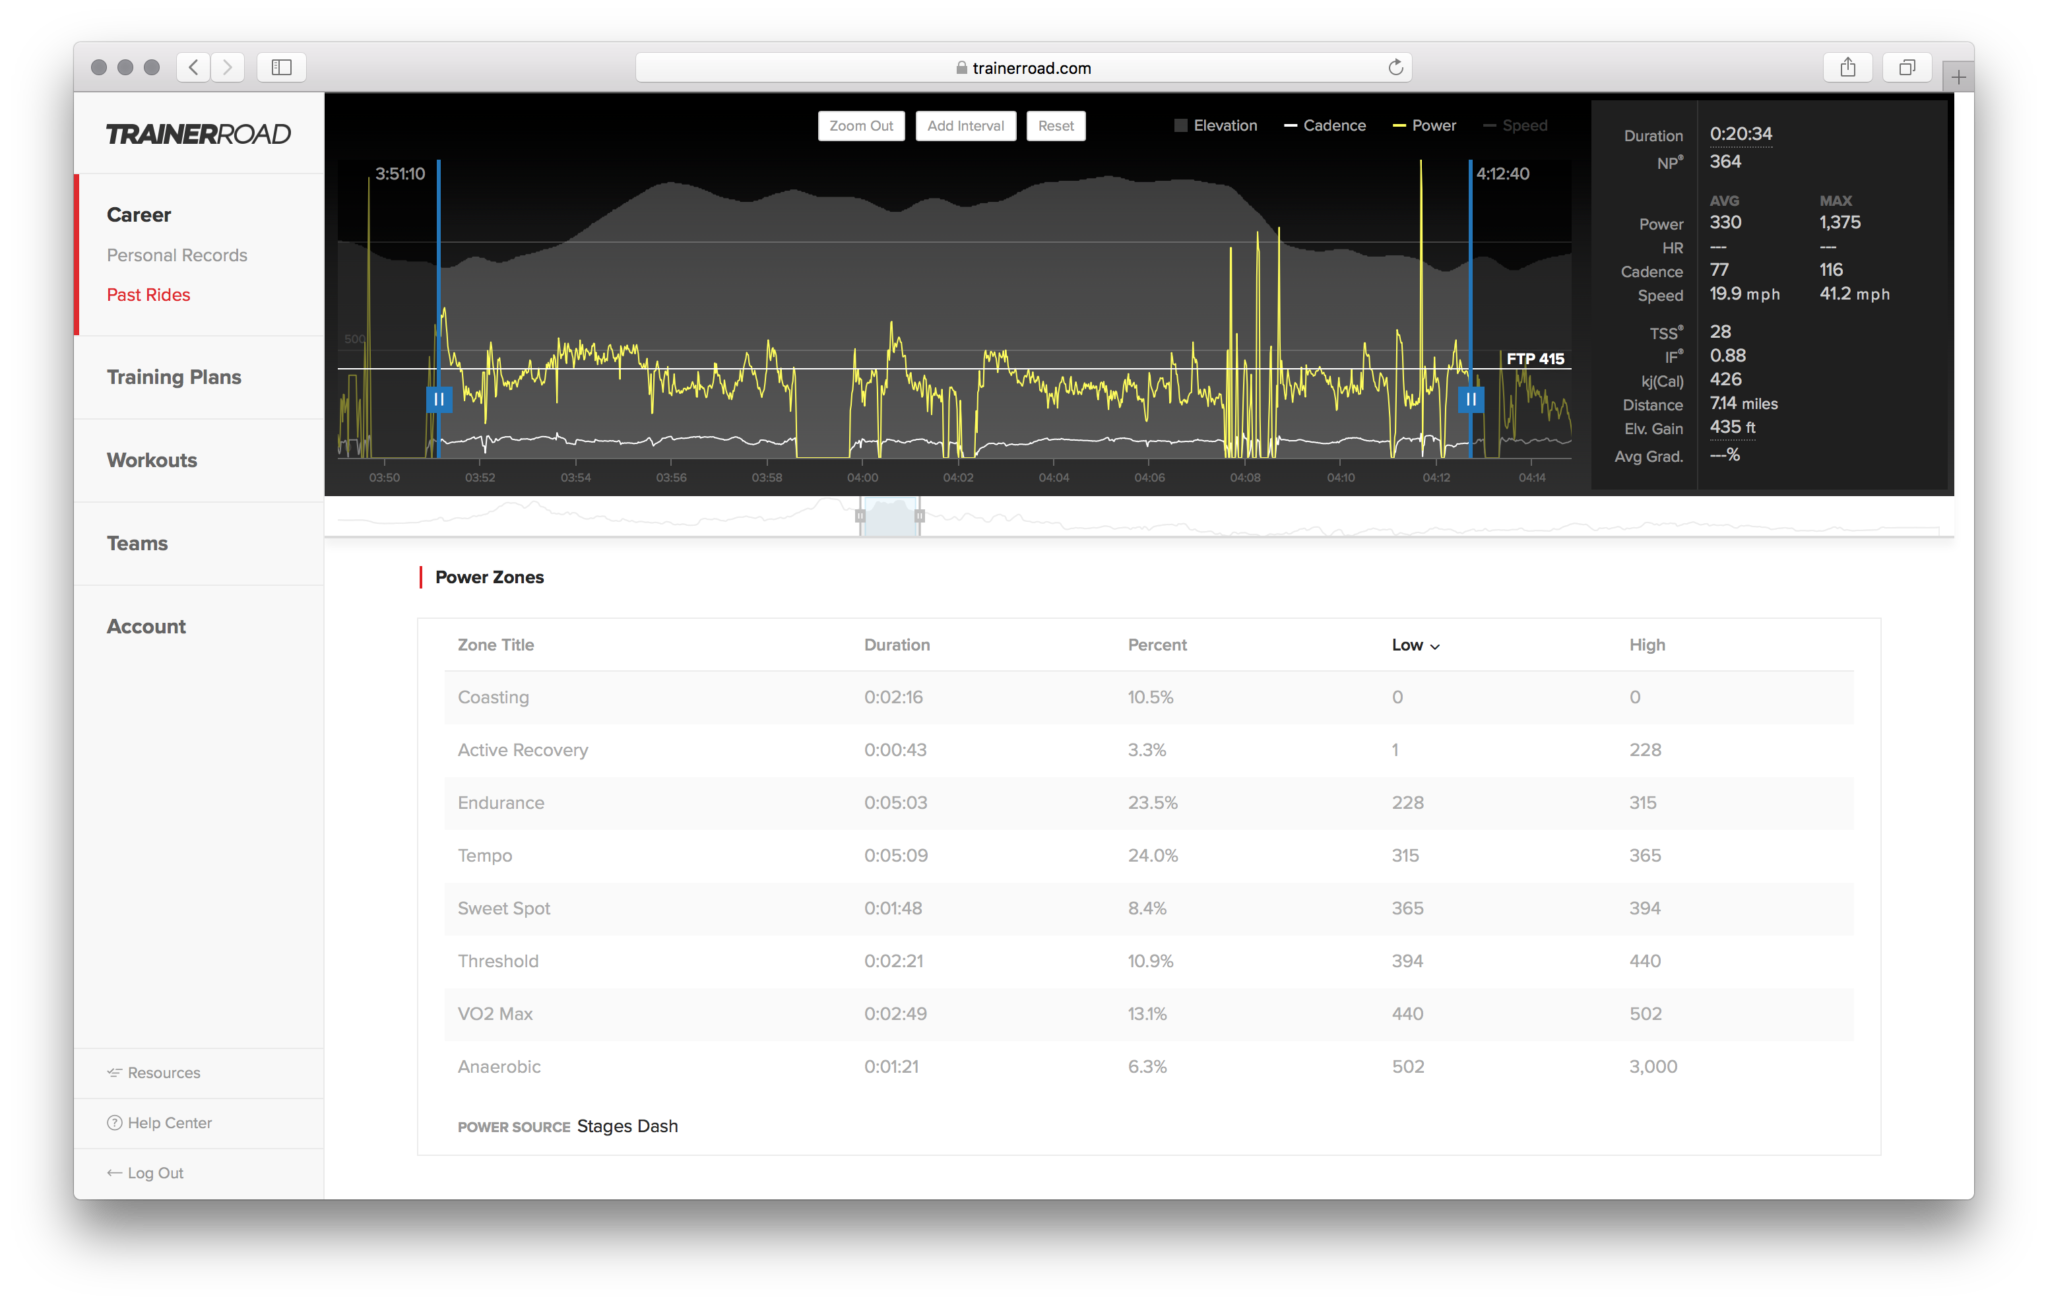
Geoff had a Normalized Power of 364 watts for 20 minutes to chase back onto the lead group, which is impressive in its own right, but when you consider it in the context of a 200 mile race, it’s even more impressive. Geoff rolled the dice with such a hard effort in the middle of the race, but with windy conditions and a strong group up the road, it was the right choice.
Using the Power Zones feature, you can see another surprising point – how much time Geoff coasted during this chase. Other than the minute Geoff spent putting in a new tire plug, he spent an additional minute coasting, the majority of which was down Teter Hill at a modest average gradient of 5%. Average riders would find themselves pedaling down gradual downslopes like this when they are in a chase situation, but Geoff’s coasting is consistent with what we see from many top racers. Any time lost from coasting in those scenarios is surely nullified by the recovery you gain.
Perhaps even more impressive is Geoff’s pacing in this effort. Rather than going all out for as long as he could, the ride graph shows Geoff put out a measured effort that was right around his threshold. Having been with the group prior, he knew that sort of effort would bring him back to the group. We average Joes tend to panic and work as hard as we can to get back to the group as fast as we can, but that differs substantially from the strategy of a pro. The takeaway? Don’t panic.
Also of importance is that Geoff swapped out the wheel with a plugged tire at the next aid station. Tire plugs can last as long as a whole season, but it’s not worth gambling with on race day.
Leg Three
58 miles, 2,582′ gain
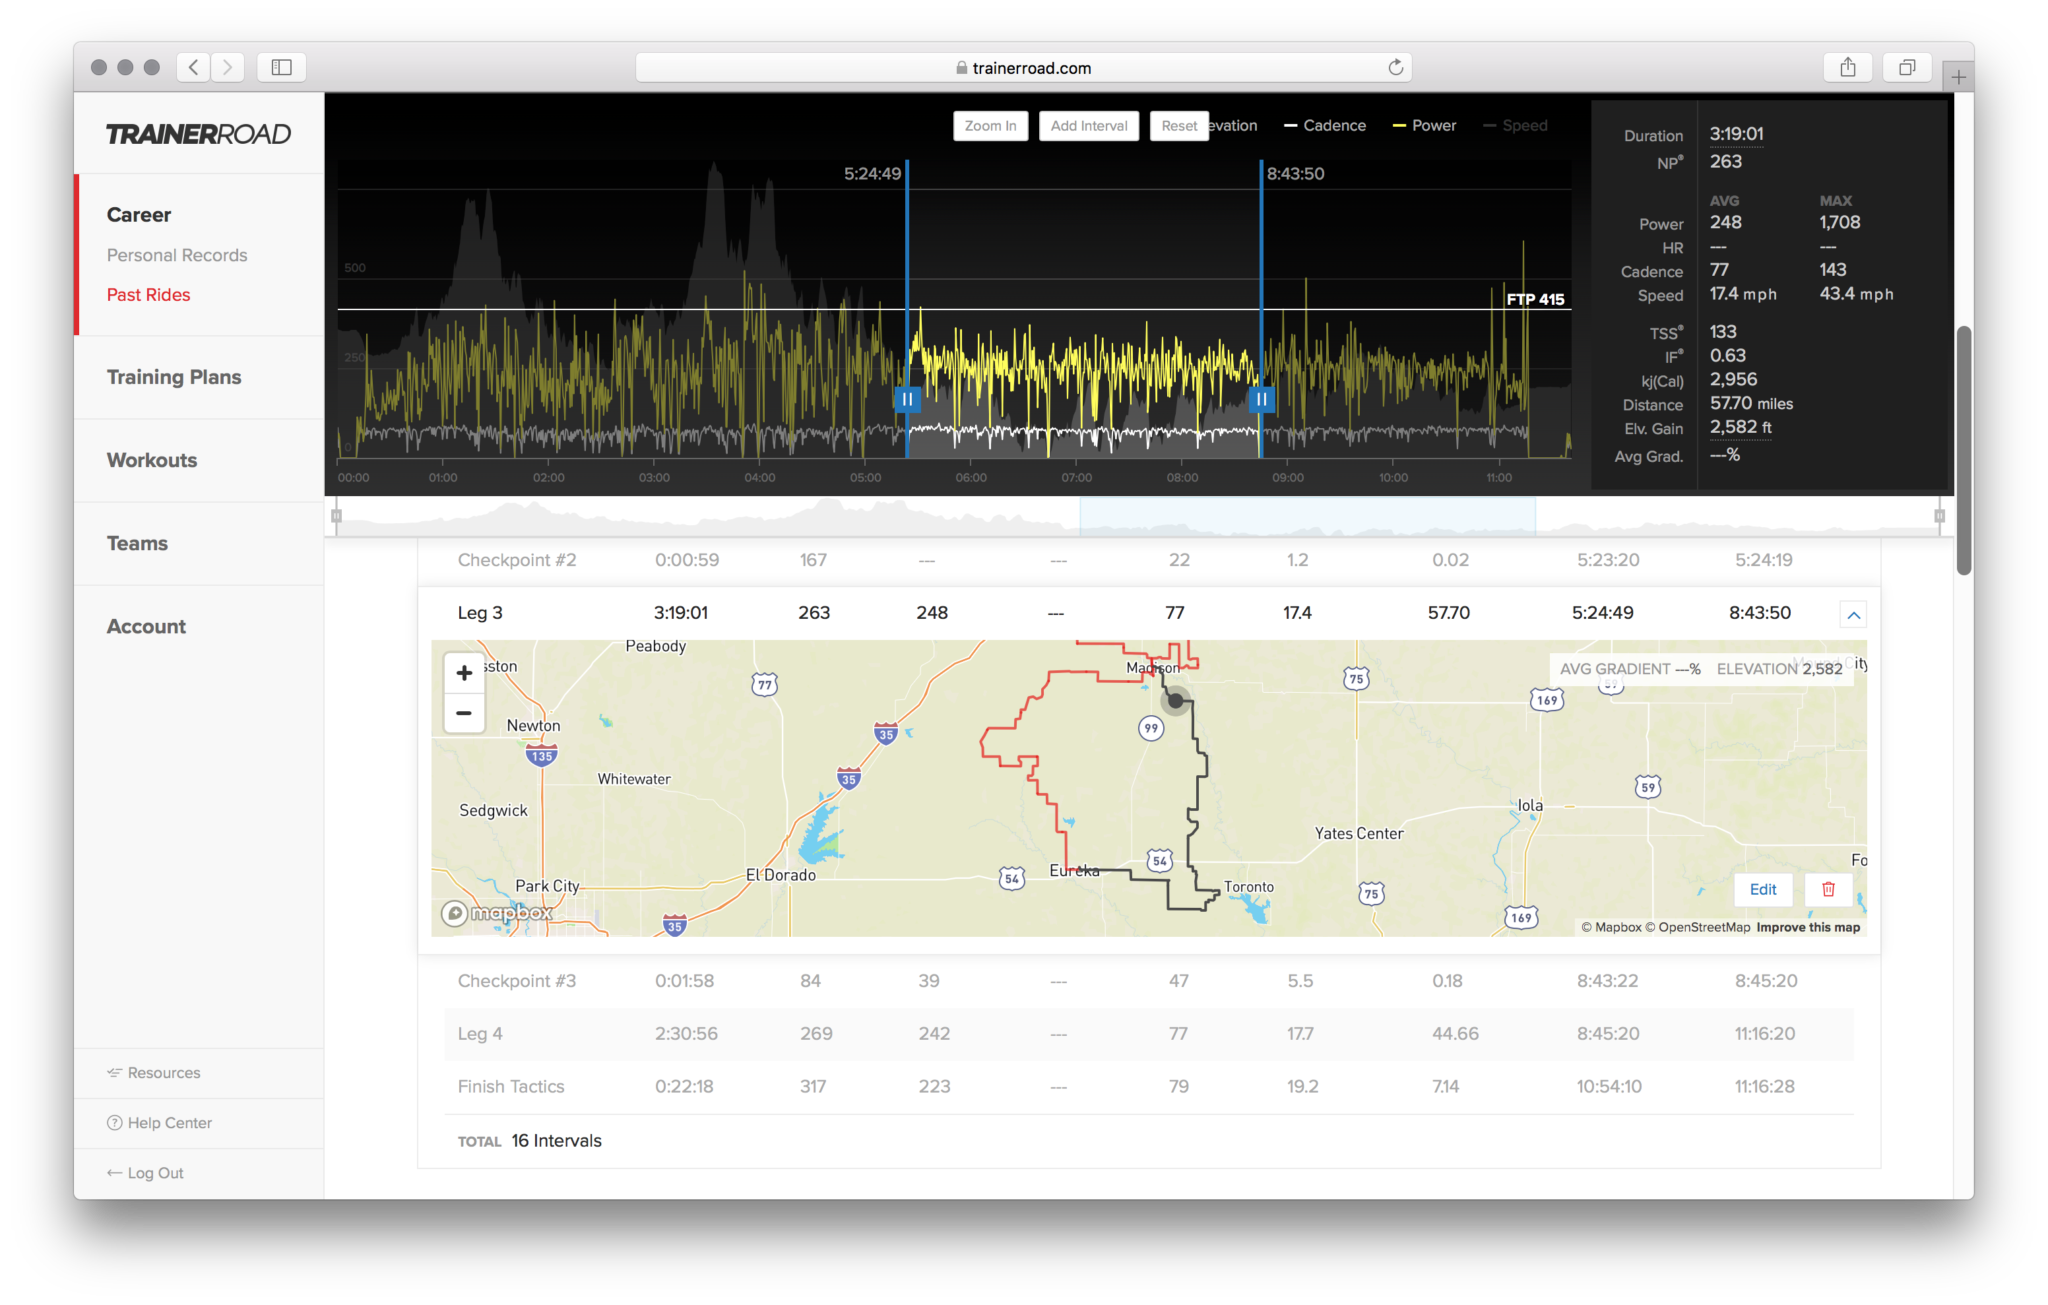
Leg Three appears to have less climbing at first glance, but the numbers show it actually has the most climbing of all four legs. The way this elevation gained happens is by a death-by-a-thousand-hills approach rather than one big blow. Most of the climbs here are 50-100′ in elevation, and while some are gradual, many are steep enough to really hurt, especially when you are 100 miles into a 200 mile race.
Geoff stuck with the group in these hills but still did what he could to be efficient. Having a cassette with small increments between gears allowed him smooth changes in cadence across the countless shifts that had to be made in these rolling hills.
The interesting part with this leg is that it appears to be the least decisive when looking at the elevation profile, but this is where the race was truly whittled down to final contenders. As the lead group left the aid station, it was a full on chase while Geoff was changing his wheel. The wheel change only cost him about 35 seconds, but it was enough to be distance and have to work hard to make contact with the group.
This brings up a good point that many misunderstand. While it is generally considered bad etiquette to attack in a feed zone, leaving an aid station full gas is not necessarily bad etiquette, and something that is common in endurance racing with aid stations. But once again, this is gravel, so there really aren’t any hard-and-fast rules, are there? 😉
As soon as Geoff made contact with the group, the winning move went up the road with Josh Berry moving off the front and Ted King bridging up shortly thereafter. A lack of cooperation in the group coupled with increasing winds saw Geoff spending substantially more time working than previous legs as evidence by the smaller gap between his Normalized Power (263 watts) and Average Power (248 watts). This is due to crosswinds reducing the recuperative effect of drafting, and Geoff being one of the stronger remaining riders in the group.
Geoff’s group whittled down to just three riders who were using a fast, rolling rut to find every bit of efficiency while fighting the crosswinds. Their echelon pattern meant that the rearmost rider was forced outside of this rut, and consequently missed the drafting benefit of the group and dealt with greater rolling resistance. These sort of conditions punish riders who have burned too many matches early on in the race, and Geoff admittedly thought his race was over several times during this part of the race.
Leg Four
45 miles, 1,709′ gain
In the final leg, Geoff noticed that one of their break-mates was strong in the flats but struggling on hills, so Geoff and his other break-mate kept the pressure high on climbs and eventually turned it into a group of two around mile 170. They kept the pace high and stretched out a comfortable gap of a couple minutes before they started to size each other up with about 10 miles to go.
This is where the 2-on-2 tactics began. Geoff chose a defensive approach and was hoping to save energy for a sprint finish, but that didn’t come without some seriously hard sprints over 200% of Threshold. Geoff went as high as 1100 watts chasing moves on the final hills before launching a 1500 watts final sprint to snag third place. Looking at the power curve for this ride in the Personal Records chart, you can see a long amount of time spent at surprisingly high power outputs.
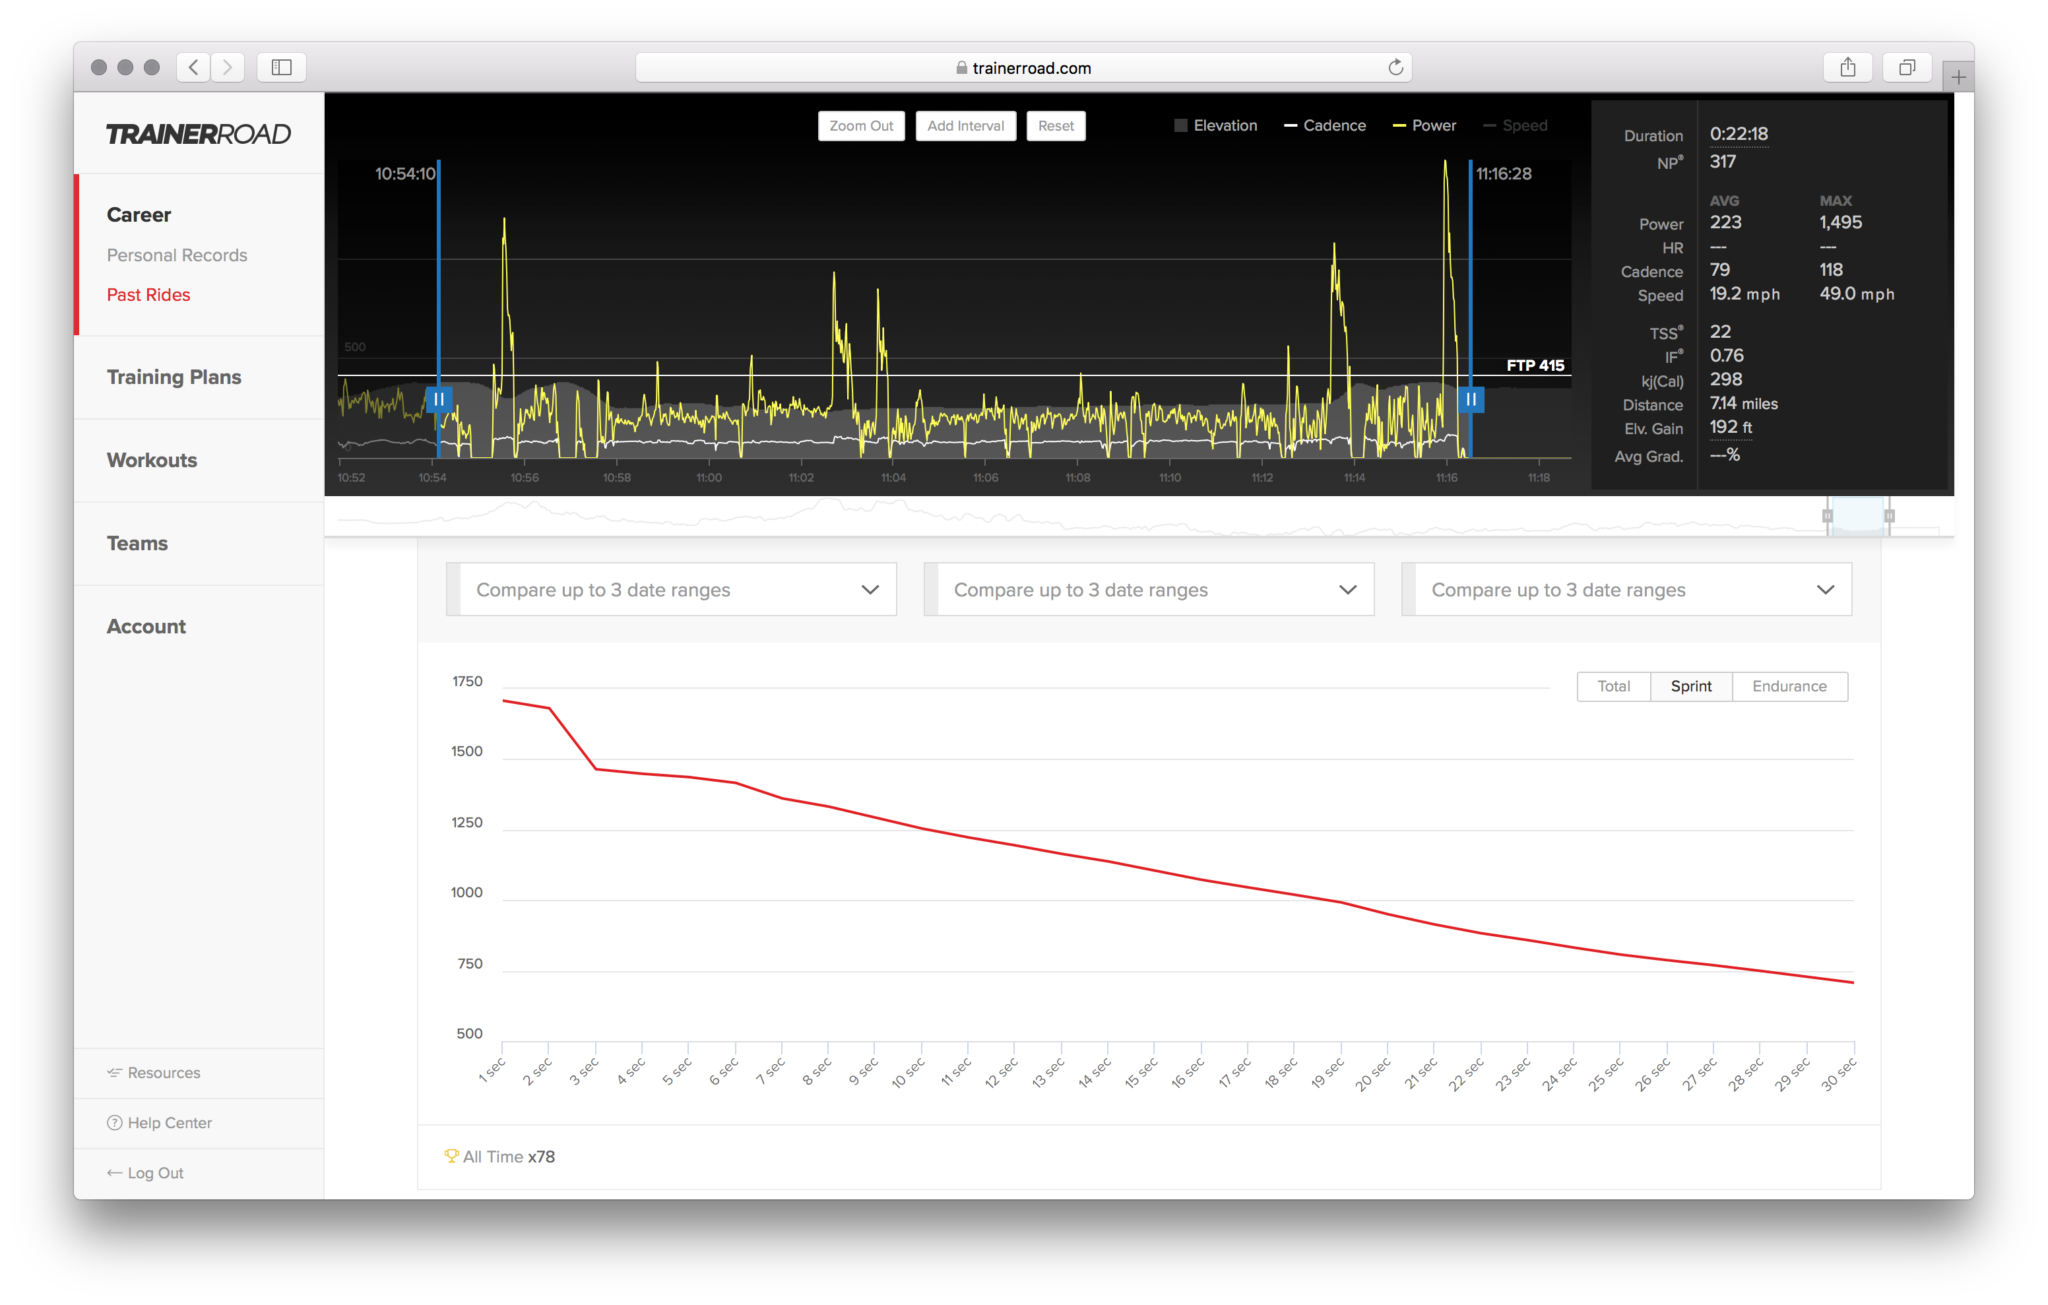
The fact that Geoff was able to put out such a sprint after 206 miles of racing speaks to the caliber of these athletes in numerous aspects. A Normalized Power of 271 watts for an hour is aspirational for most cyclists, let alone doing so for 11 hours and 8 minutes. This gave him a training stress total of 491 for the race, which rivals the weekly training load of many elite cyclists. Finally, the impressiveness of the 9,500 calories Geoff burned is nearly eclipsed by how impressive it is to replace all of that during a race.
That’s what it takes to ride at the pointy end of Dirty Kanza.
Learn More About Performance Analytics
Performance Analytics, TrainerRoad’s set of ride analysis tools, was designed to make cyclists faster without the confusion and bloat of traditional cycling analytics. For more information on each feature of Performance Analytics, learn more on our YouTube Playlist and Help Center: