After stopping training/riding in July last year, I started back in the saddle in January. Although it was just short sessions, it was still regular workouts and outdoor rides. My auto TR FTP has risen by ~20w over the year, there are regular alerts for season power PBs, and Strava often has at least a couple segment PBs. I also feel faster again, and I have done plenty of metric centuries this year.
However, looking at the metrics I think should at least show some changes I’m pretty static. Not improving but not getting worse, this goes against the improvements in FTP, progression levels and general feel. This would imply I’m not looking at something.
I know if you look at the training, I’m leaving lots on the table with the length of my workouts but Strava/Intervals shows some increases I just can’t prove it! If you were a numbers person (like a lot of the TR folk, I bet), what would you track as well to see if things worked/didn’t work?
Those metrics are only going to reflect actual efforts but they all look like they are on a gentle upward slope. Have you done all out 1, 5, 20 minute max efforts recently? It kind of looks like most of your max efforts are 5 minutes or shorter.
FTP seems to have stalled in July. Maybe do a long form FTP test/workout - 20 minute test, a 2x20 or a Kolie Moore test and see where you land?
FTP stalled as my plan moved me to specialty stage for my two events - 100km audax yesterday (good AVG speed for me) and a gravel sportive in 2 weeks time.
No specific all out efforts planned but then not ever really done specifically so I feel I should see something. I guess maybe in previous years I might have done that as a side effects of the club rides.
I don’t doubt I’m a bit better just not trackable. Hopefully after my events auto FTP will suggest I bump it.
That’s a gap in my opinion that TR leaves open. The purpose of the specialty phase is not to increase your FTP, but to “hone the blade” and to make you better at efforts, which are crucial to your discipline. The corollary is that FTP is no longer a good performance metric, and TR does not offer another performance metric (except for PLs, which are not a performance metric IMHO).
That’s definitely a gap. I wish TR would expose one or two performance metrics in addition to FTP, which are relevant for the training plan you have chosen.
Might not be something you know, but anything you’d want to track at this stage? I’m sure intervals.icu captures it (assuming there’s a suitable thing) so could track it there until TR finally add some better graphs/stats.
I’ve tried out intervals.icu, but I felt it was overwhelming. In essence, I had (and still have) no idea what other metrics were relevant for me. They tend to be extremely specific and hard to train and test for.
IMHO TR should surface additional metrics (perhaps optionally) to tell athletes what they are optimizing for (depending on the type of events they want to enter and the training plan they have chosen).
Out of curiosity, what do you graph and why? How does it help you to improve your training and derive actionable information? (Not trying to argue, I want to learn.)
It’s a bit geeky for the initial reasons: I wanted a database for some python practice. This evolved to a monitoring system from the database - again as a learning experience.
I’ve got two dashboards really:
a body metric one with weight, body fat, blood pressure and bmi.
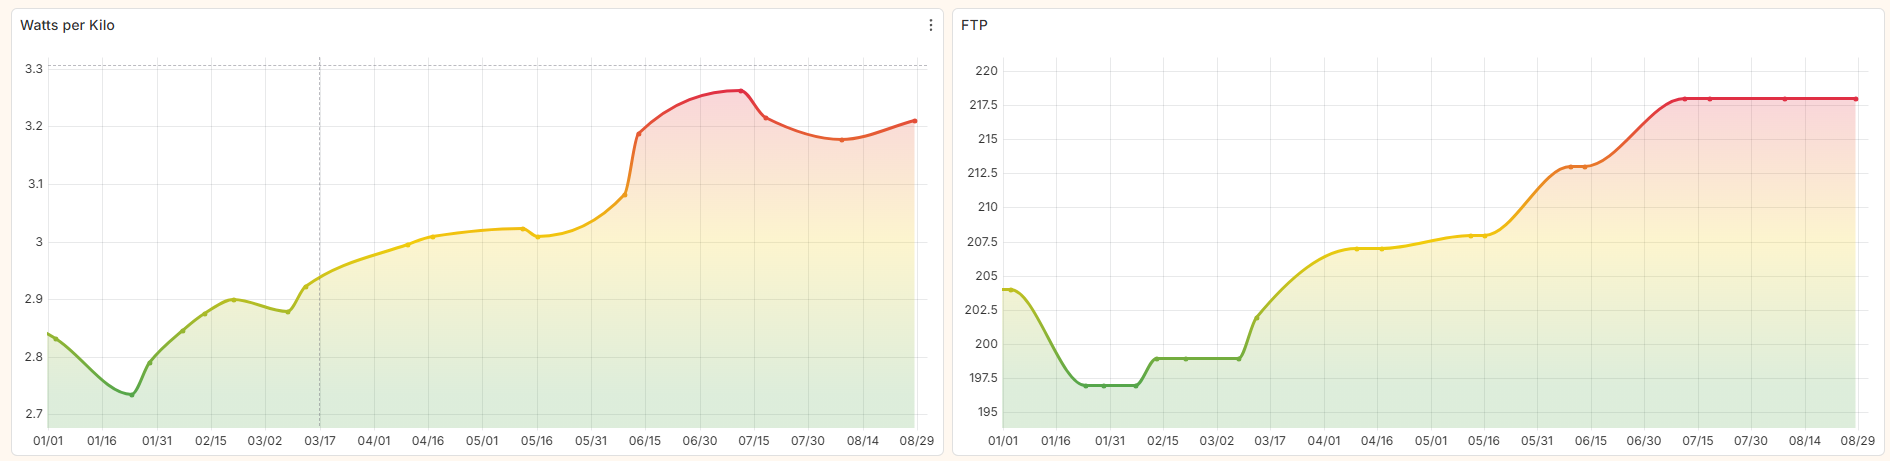
a bike one with FTP, w/kg, best and AVG powers at various intervals.
The idea is to easily see any changes in me and my performance. Blood pressure was added after light headedness and iron deficiency from some problematic eating. It was also quite apparent when my mum passed that everything fell off a cliff.
So mostly done to learn, but also has helped with real life.
If you want an easy way to better see your progress without building custom charts, you can try FormBeat. It pulls in your rides and gives a nice overview of important metrics such as power PRs, power radar, FTP/W/kg trends, efficiency factor, Form & Fitness (fitness/fatigue), decoupling for endurance and weekly summaries. It’s a simple dashboard that actually shows if you’re getting faster.
Looking at your graphs, you’re tracking averages per month. This could be skewing your perception of improvement. In Intervals, after each ride, you can see your performance for various power/minute lengths versus the season as a whole and all time. You can also hover over each historical number to see what date/ride achieved the max. So, for example, if you want to improve 20 minute or hour power, you could be looking at how you improved during the key sessions, not as an average of all rides per month. You could do 4 easy 90 minute rides and 1 VERY hard one in a week. Do you want to know how you performed for 20 and 60 minutes as an average across those 5 rides, or do you want to know how you performed on the 1 ride where it mattered?
Figure out which goals you have (is it improving 1 minute power? 5 minute? FTP (or 60 minute)?)). Once you know what your goals are, compare individual rides for those power durations.
Note: if you don’t see the duration (or time period) you want in intervals, you can configure what is shown.
My thinking for the average powers was that even with the lower efforts dragging them down if I was improving then even the more chilled rides should have an increase.
Might be a wrong idea but that’s the point of asking about metrics so I can learn.
This is interesting, “I know Python”. Is there an API or how do you access the database? And I assume you use Python to plot the data from your query (and perhaps do some basic computations)? Or do you simply download everything and you do all the processing?
Yeah, personally, I don’t see much value in that. The monthly average is going to skew based on the workout/ride you do. What matters is how you perform against your goals.
First lot of graphs were done with matplotlib accessing the database and making acceptable graphs. This was good practice, albeit ugly.
The current graphs are made using a program/app called granfana - this is used to monitor a million different things if you want. One option is to read a database and it makes the graphs for me.
Data is manually pulled from various places as the graphing/data handling was more interesting than working out the Strava API to get it. Lazy I know!