What does "Consistency" look like? (largely meaningless post)

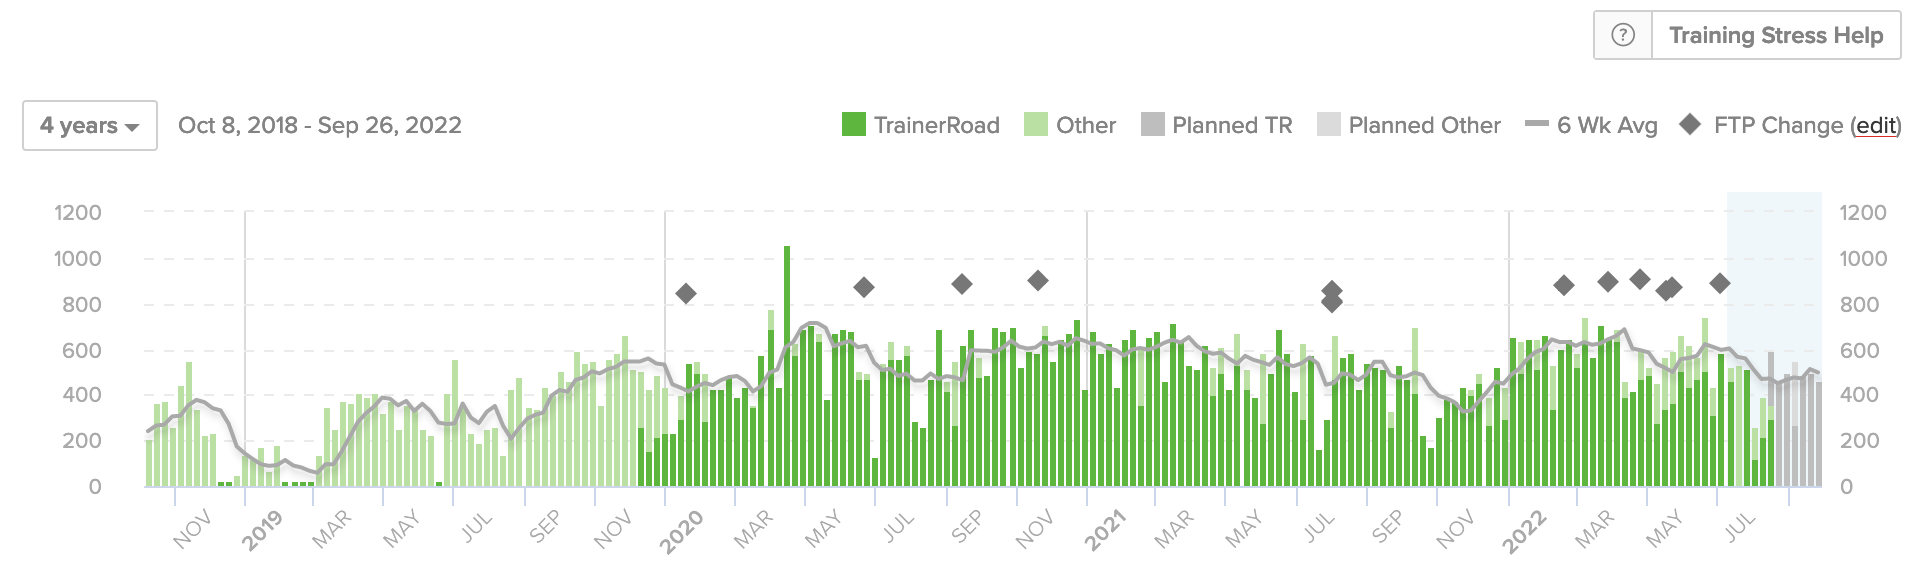
It’s been a while since the TR AACC crew focused on consistency, but I was thinking about it the other day and wanted to look at it via one method. The Training Stress chart in the TR Career page on the web is able to show up to 4 years of training TSS, along with FTP changes. I have no idea if this follows the TR guideline generally speaking, but the ebbs and flows here are interesting at the very least.

The dark green “TR inside rides” in comparison to the light green “Other” is interesting to see too. I get heavy inside work well into the season with addition of outside stuff around May or June. My tapers for A-events as well as some personal “resets” are visible just past mid summer too. And in the last few years, I have taken some very loose weeks around late Sep / early Oct to just play or not even touch the bike.

Also interesting is the relative lack of FTP changes (gray diamonds) I had in the last year with AIFTP mostly in control. As mentioned some of this is due to using AIFTPD and trying to trust it.

Most of those were testing (likely Ramp in this history) along with what I remember were repeated adjustments trying to fine tune my FTP through the season. Additionally, since changing FTP thru any method also resets AT PL’s, I was typically leaving FTP alone and letting AT drive the bus with my survey responses.

Compare that to prior years with the greater density of FTP changes. Most of that timeframe was FTP changes via Ramp Test. But more often than I wanted or should have done, I was tweaking my FTP to what I thought it was after the test or feeling in certain workouts.

FTP seems to progress in each year / method, but I know I was less stressed and over-thought the FTP less in the last year. I was getting workouts that generally felt “about right” with just enough Hard, Very Hard and even the odd All Out ratings to feel like I was being pushed.

But that was in stark contrast to prior years with the default TR plans and my tendency to blow up in some phases. Those issues led me to my older Alternate Layout method with shorter Work to Recovery week layouts than the TR defaults. Those mods largely keep me more ontrack, but I sure hit some of those old plan workouts that still crushed me (looking at you… Leconte & Mary Austin :wink: )

Not sure where I was really headed with this. Bit of a wandering stream of consciousness review that may not have any real conclusions. I have also considered this in very broad review of my personal gains and results in events over these times.

This year looks to have been a lower overall “density” in a way, but I hit most of my events within the power and result ranges I had in mind. So maybe I can say that the AT + AIFTPD setup allowed me to maintain or improve as I have in prior years, but without the extra handling and more common explosions of the prior years?

Has anyone else done a similar review?

5 Likes

I don’t overthink it, it’s just being consistent with doing all the things I should be doing over a period of months and years. Which is:

  • training regularly with structure
  • good sleep habits
  • good nutrition habits
  • off the bike stuff like strength and mobility

The volume and purpose of the training doesn’t really matter too much - you can be consistent with 3 workouts a week or consistent with working out every day. What matters is sticking at it and getting things mostly right. I.e. Skipping a session is fine when you need to, just don’t regularly skip weeks or months. Or don’t beat yourself up about having too many drinks and a bad nights sleep, just don’t do it multiple times every week.

1 Like

I haven’t done a review like you did, per se, but have kept it in mind as I map out my year each winter.

I picked up cycling in 2016, but was still largely focused on running and did no structured training. 2018 I moved, curtailed my running, and started indoor training, mostly Zwift, and experimented with their individual workouts but no plans. In 2019 I trained with structure for my first century, utilizing FasCat plans. That winter I started with TR. I didn’t take a proper off season 2020/2021 (mistake) and got a bit burned out by the latter half of 2021 (seen in the declining TSS all summer). I did FasCat’s 10-week weight lifting program for cyclists Oct-Jan which, from a cycling perspective, aligns well with TR’s Traditional Base plan, then tried the experimental TR Polarized Base and Build plans (huge fan), then Plan Builder (base / build / specialty) for the spring and summer this year. I’ll almost certainly repeat that starting 1 Oct.

2 Likes

You are all definitely more consistent than me to your TR plans. I only joined TR in July 2020. Apart from an April/May blank in 2019 (major op) I was consistent to my coaches plan. This year I’ve took time away from the structured plans and often substituted Wednesday TR sessions for a paceline (chaingang) and sometimes skipped Monday too when its been a big weekend or I’ve managed to schedule a Tuesday TT :+1:

3 Likes

Great discussion. I’ve vaguely looked at “fitness” over time to try and see trends, but haven’t looked back long term.

Your chart looks great and illustrates pretty terrific “consistency” to me. Great work!

I just tried to make a copy of my TSS Chart but can’t see where to change the dates to make it go back to a long term type comparison. Is that only possible on the desktop web version?

1 Like
  • It might be web-only. I am not sure where to even start to find that on mobile or desktop apps.

This is all I can see on the web version. I use my phone though so that might be a limitation. I can’t see a button to switch to desktop website though :man_shrugging:.

Oh, that could be a mobile web-interface limit. Any change you can flip to horizontal and get more options? I know I find several limits with mobile web TR site access.

ETA: I just tried via web and my phone, horizontal (landscape) helps give a better view, but I don’t gain the year range option that is available via desktop web.

1 Like

Yeah, must just be a limitation of mobile. Oh well. I’ll admire yours and others smooth graphs until I go back to work next week and try on a computer :sweat_smile:.

1 Like

One thing that I find interesting looking at my data this year, and thinking from what you’re saying. FTP changes and AI-FTPD can make TSS tracking awkward.

For example, my most recent AI-FTPD is 329 which means all my recent rides show a lower TSS. Whereas Intervals for example, I just leave it at what I am confident to be my MLSS (i.e. changes less frequently).

Sure, since TSS is leveraging FTP for it’s calculations, having a different FTP in each app will end with different relative TSS even when the ride file power data is identical. Messy at times and it’s the reason that maintaining FTP to be in sync between multiple apps is a common source of different data and related confusion.

1 Like

I’ve been glancing at mine a bit lately, since I just started my first plan in a year. As it turns out, those dark and light green bars correspond pretty tightly with fitness, or in my case, a lack there-of! :wink:

This was, by far, the lowest number of hours I’ve seen on a bike in a given year and why my sporadic riding doesn’t relate to high FTP numbers. It was just nice seeing a very obviouls reason for this; a bit of a head-slapper moment for sure.

I might delve into my 3 years with TR and see what’s what and add some better details other than the obvious, “when you don’t ride a lot, you don’t get faster”

2 Likes

Cool topic.

As you can see, I haven’t been training very long. Started TR in May of 2021, so a little over a year of actual training. I got an indoor trainer not long after I started riding, in october of 2020. The summer of 2020 is when I started actually riding.

First FTP test with TR was 283. Now I am at 314 but also weigh about 20 lbs less.

That gap from October to December of 2021 is when I moved from Europe back to the US.

3 Likes

Looks like solid start to formal trainer work at the least, and a trend to build on from what I see. TSS and FTP gains at a quick glance seem like positive indicators.

FTP/KG would be cool to see graphed here too. Weight is a missing aspect within TR data at this time, so I hope they add it in the future. It’s possible to stall or lose on FTP while gaining on W/KG. Just nice to be able to see from more angles to get a better picture.

2 Likes

Here’s mine. 2019 into 2020 was very productive and consistent. That’s when I did my Z2 experiment and it worked.

2021, I was not as enthusiastic and dropped the volume a bit and added more gym work. Did well with that and was consistent until July. In July had to prepare our home of 20 years for sale, get our stuff sorted for the move and then move into our new home. Along with working for a pay check, that all took a lot of time and energy away from biking and weight lifting. You can see that I was still working out for fitness, but the CTL trace shows a long steady decline.

I spent Dec 2021 and Jan, Feb, March 2022 looking for motivation to “get serious”. Instead I dabbled with gym and bike and did a fair amount of work around the new home. Wife and I drastically underestimated the time and work it would take to move after 20 years in same place!!

Finally… in April I both retired from work and kicked myself in the arse about getting back to the bike. I’d lost a fair amount of fitness so plotted out a steady build. Priority #1 was to ride 6 days a week. Priority #2 was to build TSS in a reasonable way and focus on Z2/Z3 riding. I’ve done one “vo2max” type workout and zero threshold type workouts. Just building base and fitness.

Plan is to keep doing 10-12-14 hours a week of riding steady until the weather changes. When it does, I’ll switch out some ride days for gym days and let the CTL fall. I’m excited to do a good job with both lower and upper body gym work this winter and then get back early to serious riding.

If I can make 2023 look like 2020 it will be a good season and I might even pin on a number again and give racing a go.

4 Likes

Great looking graph and story of the life behind it. My basement remodel was part of my similar dip in Oct 2021. Home work is a real deal demand. Nicely done on it all :+1:

3 Likes

My goal is to average 8 hours/week or 416 hours for the year. Strava mobile has a nice “up and to the right” graph on mobile, that’s the one I usually look at. On the computer now so I’ll post the Veloviewer web graph:

Was perfectly tracking up and to the right (staying consistent) thru May and then a life happens moment derailed things for a month. Now I’m back on track to hit 400+ hours this year.

You asked about consistency, not results, so I’m just focusing on the consistency angle.

3 Likes

That’s a good one too. I have played with a similar one via the Strava Elevate plugin.

This is the Strava mobile graph that I normally look at:

Cool. I rarely use the mobile, but skimming it… there are way more options there than I have really explored. Good to learn and I need to poke around there. Appreciate the tip :smiley: