Great response. Thank you. I actually did 20 min @ 109 watts before that reading. I don’t understand why the initial value is so high.
Just a bit of background. I did an INSCYD test in November of 2019 with Steve Neal and spent a load of time riding around FatMax. From November of 2019 through May of 2020 I rode at FatMax or what I interpreted as Steve’s tempo (82/83% of MHR). I saw power at 131 BPM (heart rate associated with FatMax in November) increase from around 130 watts to 160 watts, and ended up with around 700 hours on the bike in 2020. I wonder if that’s why there is the massive dip between 130 and 160? Since I’ve done so much work there? My VLaMax in that initial test was .57 so not super low - I’m not sure how much this matters.
Steve actually owes me a second test as I paid for two initially, but I’ve not got around to asking him.
Glad to help or at least offer a place for discussion! Perhaps that first sample was also contaminated. Warm up looks good so that is odd to my eye… It doesn’t change the results, just makes the curve less pretty.
That’s great working with Steve. I like some of his approach. Generally, I gravitate toward the lots of Z2 type training concepts. Extending TTE like Kolie talks about. Steve’s concept of accumulating time at fatmax. Polarized and ISM concepts which I interpret as lots of riding plus some stuff. Determining the numbers that go with “lots” and “stuff” is the harder part of prescribing and planning training.
In terms of training, “stuff” for me seems to be a good VO2 workout once a week, a specific threshold day (2x20, 2x30, 1x45 or 1x60) and then filling in with good volume with time spent in and around LT1. When I do that type of pattern it works and the LT curve and MLSS tests reflect the fitness. When I try to get fancier, get myself into weird spots. Using the LT tests as a backstop for what I can see by power + HR and feel by RPE has been useful (and entertaining).
That’s your baseline. With training at it you move it further to the right.
The first measurement may got contaminated as well. It’s easy to squeeze out too little of drop or touch the skin with the test strip. Always discard the first drop, wipe it away and squeeze out a big, round second one.
Resting value is often above baseline though. However, since you did some warm-up this is not a resting value anymore.
Sounds interesting. I read a paper that showed dmax as a good estimate for mlss but only when using 3 minute steps. With longer steps dmax tended to underestimate mlss. I wonder if self testing also has the same effect since we need to stop to measure while during a graded exercise test someone else is testing you.
(basically talks about why critical power is a better estimate than MLSS)
Before I saw that one I was interested in trying one out since I haven’t been having great results estimating MLSS through lactate testing. The 3 min continuous test is pretty easy to execute… if you are motivated. I think that NSCYD uses this as part of their testing protocol, which it seems that the NSCYD test is more about CP and how it fits in the mader and heck model to estimate LT1 and remaining power duration curve.
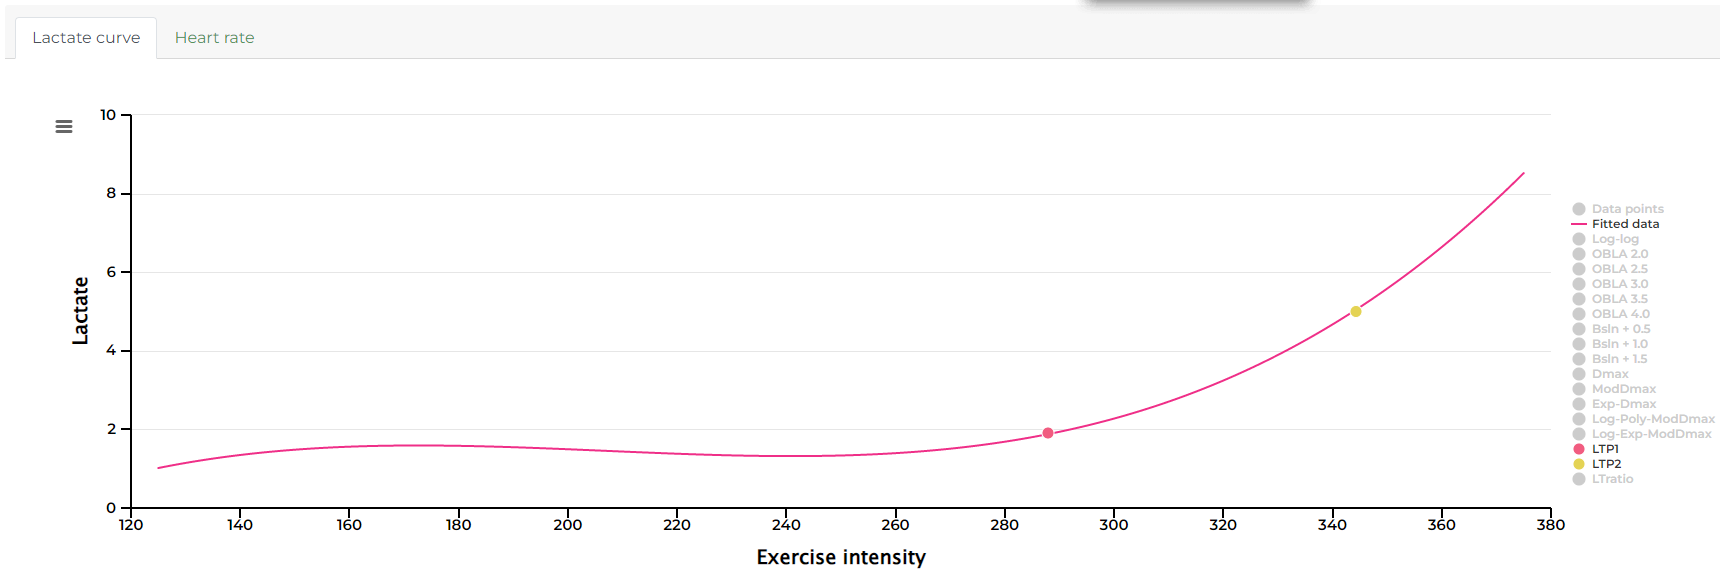
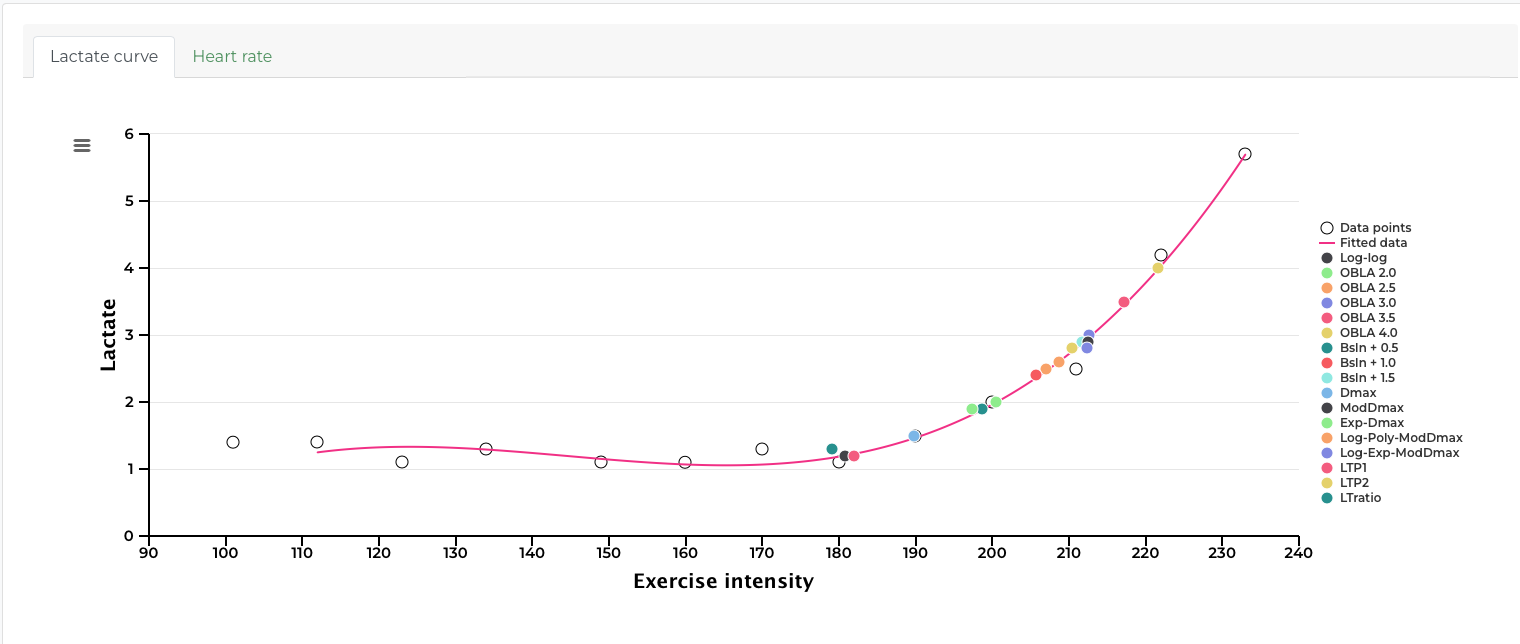
Here’s my charts from that effort: all way, way, above what I was getting for lactate measurements, probably because it takes close to 30 minutes before getting to a steady state as you had mentioned in your last response. CP from this effort would be 288, that is the 30s avg at 3 minutes, I kept going to the top of the hill, so the total duration was more like 5 and a half minutes since I had no idea what the duration was, and in the last 2 minutes the power dropped down to about 270 watts. When doing some of those old over under workouts that used to be a part of SSBII, it was clear though that even if that FTP was higher than what I could sustain for an hour, the over/unders were above/below that specific point.
The 3-min all out test is a truly horrible experience. I can’t see anyone using it regularly as a performance test - its much more tolerable to do time trials in the 3-15min range semi regularly and build a CP curve from that.
Re MLSS vs CP - there’s a paper by Jones & Pringle from way back in 2002 on this topic finding that CP was 5-10% higher than MLSS, so I guess similar to what you’re seeing. Generally you always see steady-state responses at MLSS (hence the name) whereas at CP (or even slightly below) you tend to see a mix of heavy and severe domain behaviour, for example oxygen kinetics will stabilise but lactate probably won’t.
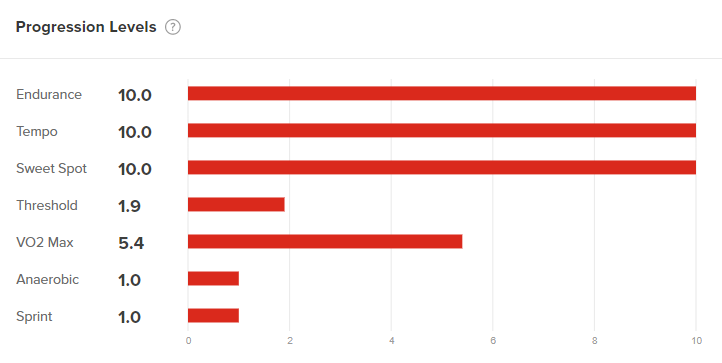
as a side note, TR AT is setting my FTP to 370W but while I already have level 10 for the first 3 zones, I know AT will increase my FTP again but I doubt this is realistic, I can probably maintain 340+W for 1h, for sure not 370+W
I have just started doing lactate testing at home as well (but been using a coach for 1,5 years) and my numbers are as following:
LT1 - 220w
LT2 - 285w
CP - 310w
Best 10min: 335w
Best 20min: 325w
Neither of those 10min and 20min tests were done fresh (pretty much never fresh since I only do rest weeks when needed, no 3:1 structure or such).
I have pretty much not done anything above LT2 since I started testing, just LT1 and LT2 intervals, and then added endurance rides on top of that.
Usually 3x20min @ LT1, and for LT2 intervals ill do progression of 3x8min, 3x10min, 3x12min.
So I train with lactate zones, but that doesn’t really represent critical power (FTP). Hence why I find it hard to train with TR since ill burn myself out if I try to train according to CP/FTP instead of LT1/LT2.
With a lactate meter. They’re a few hundred dollars and the strips are -$50 usd for 25 strips. Lancets, calibration solution, and isopropyl alcohol are small extra costs. DIY.
Quite cheap when some folks are charging $150+ per lab session for lactate only.
I have a lactate meter, but in my first few attempts struggling a bit to get good data (so far either at rest or low wattages) - most the time either getting an error code or “Lo” reading meaning it is too low for the range of the device (>0.7mmol) or an error. The only reading managed to collect so far was 1.9mmol after about a 12 min 215w effort, after about 15 strips i have tried. The device is the Accutrend Plus (Accutrend® Plus system)
Any lessons to improve consistency of data collection here?. Anybody using clever techniques/tools to actually get the blood sample onto the test strip (these strips do not have the little “sipper” that some designs have that sucks the blood onto the strip - you have to try get the blood onto the strip without touching it to avoid contamination, which is easier said than done.)
Is it possible to collect the blood samples onto the test strip but then run them through the analyser at the end without affecting the results. My analyser takes 60 seconds to do the analysis so may make the gaps between steps a bit quicker to do all the result calculation after, rather than during the test itself.