Alright, trying to figure out what I’m looking at. Intervals.icu has me detraining for multiple weeks now. I know TR goes through a 3 week block with recovery week, but since the trends gone on for weeks I don’t think it’s just a taper…
First Chart! Intervals.icu
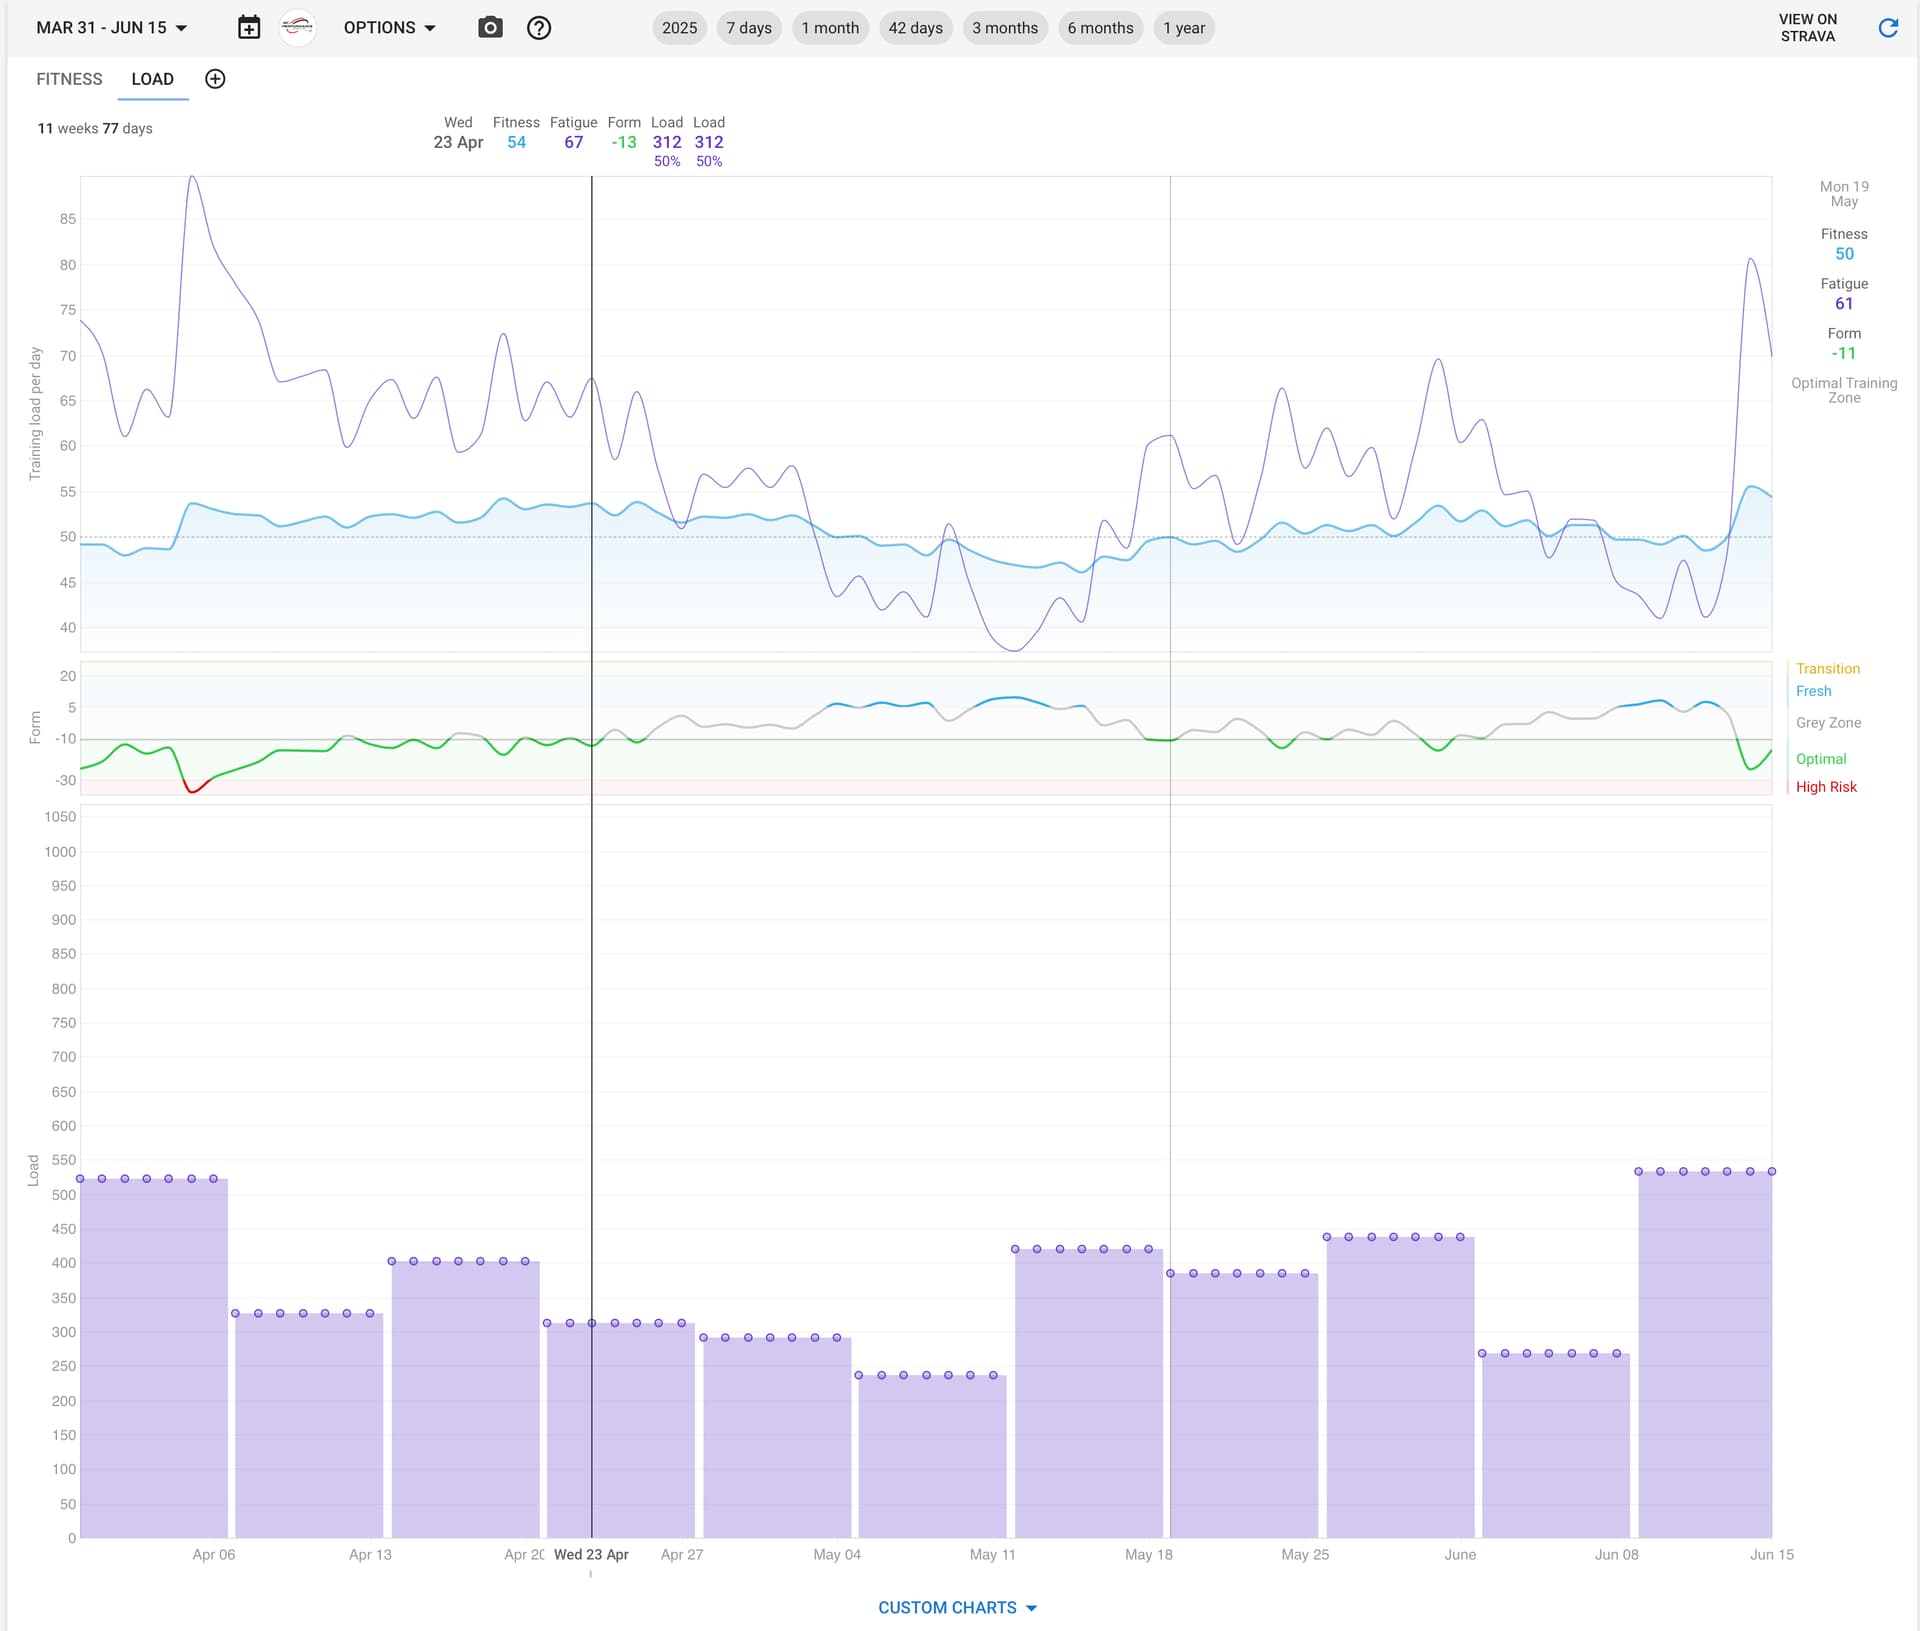
The top graph is my Fitness(CTL)/Load(TSS) and optimal zone. You can that somewhere around Apri 23rd, it has me out of the optimal zone and it stays there till today…
The bottom chart is my weekly load/tss totals.
Looking at my TR calendar, the TSS mostly lines up. The Trainer rides are on point to the number at most 1 or 2 points off for TSS between TR and Intervals.
But for outdoor rides, even the ones on my bike with power, there are significant differences.
For example, I went on a 3 hour ride yesterday on my Crux which has a quarq spider. TR puts this ride at 170 TSS. Intervals has it at 135 TSS. So TR is 26% higher TSS than intervals.
I see similar disparities on my MTB rides, which do not have power only HR.
The more outdoor I do, the larger the weekly aggregate TSS gap.
I checked things like: Avg HR, Max HR, speed, time, power profile when available. These all look consistent.
There could be something else contributing, but this definitely is part of it. I think as the weather gets better and I’m getting out more, the skew is growing. Like I’m going from 100% indoor, to 2 or 3 outdoors a week sometimes.
