Wow! This is all very impressive! Any updates?
I’m a bit of a newb to python and R trying to find a way to better visualize garmin workout data based on heart rate zones–like add an interactive interface to label sections/laps of a workout as “interval”/“rest”/“technique”/etc, and maybe visualize these types/intensities of workouts in a calendar view. For the past 2-3 years I have been training for nordic skiing by heart rate zones (polarized periodization), but haven’t done much biking, so this is really cool to see the metrics + analysis different sports are using!
Any things you have learned in doing this stuff that a newb should take note of?
No big updates, I sort of abandoned development of the “twitter” stream functionality. I had my site hosted on heroku but I quickly had met my allocation of data so I’ll have to pony up if I want to make it a real site.
However, I am using it as my daily PMC on my local host, so at the very least it’s been something I’ve been able to use. Would love to make it live again, but with so many good options and with nothing to really distinguish what I’m doing from the already existing options, I’m not sure if it would be worth trying to make live (I’d have to charge money, and with that comes the pressure of maintaining others’ data).
bringing this one back from the dead! I kind of just stopped working on this over the summer but am starting to get back into it, mainly to polish it up, but what I didn’t realize back a few months ago is that the individual ride power curve I made (and some of the suggestions others made), doesn’t seem to provide the correct curve
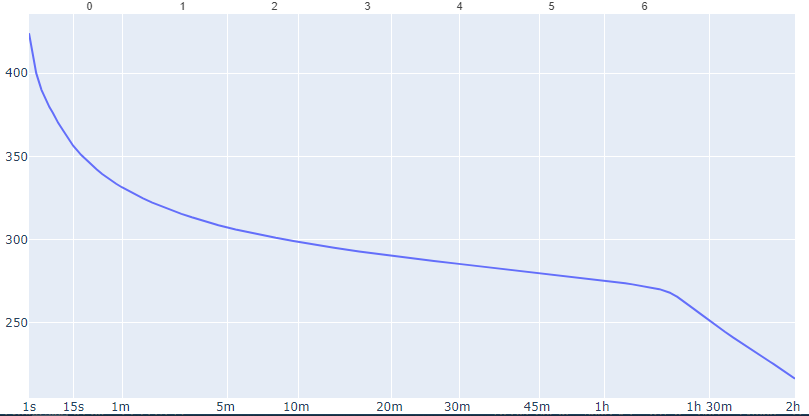
for example: my ride from Sunday looks like this on TR:

whereas, the charts I have look like this
my original

using the post by @hbuhrmann
anyway, i’m stumped on how to get the various changes as seen in the TR and intervals.icu power curve. Hoping to get some inspiration on how to calculate this, because I’m off somewhere!
Just following up to myself and putting this here for posterity, I know some folks find their way to this. So I solved the problem with doing the ride power curve. Some of the suggestions above were accurate, with a caveat. I did rolling.mean.max with pandas, but the key, I found, was doing it within a for loop, which I believe loops through all combos between 1sec and whatever length the ride is, gets the maximum mean of each iteration, puts it in a list called intwatts and then I am able to put that in a dataframe to graph
intwatts=[]
for i in range(1, ridelength):
            iw=spc2['watts'].rolling(window=i).mean().max()
            intwatts.append(iw)

So it’s been a while since I read this thoroughly, but Mark Liversedge (of Golden Cheetah fame) posted a great article on his blog in 2015 on Finding TTE and Sustained Efforts that I vaguely remember thinking at the time could be used to build this sort of power curve with a vastly reduced complexity (computationally from O(n^2) to O(n) if I remember correctly. Worth a read for you even if it doesn’t help with your above issue!
So I moved on from the single ride curve to a career power curve. Fortunately, it went a lot faster. But I need to make this a background process because generating one on page loading takes a long time (makes sense, I have 355 rides and apparently 1.9million lines of data). So I need to commit this to a model in django and have the process run in the background to keep it updated
The scaling needs work, but the data is all here


For the nerds and devs here, I am a happy database chap so fancy trying to utilise it in some fashion.
If I had a PostgreSQL database with some stats in it (ftp, weight, whatever) and wanted to build a very basic page with some progress graphs what should I be looking to learn?
Personally I use Django (basically python) for my thing with Postgres and I’ve used bokeh and plotly to do charting. I think it’s about as basic as one can get, I’ve got my own editable FTP history built in so my PMC adjusts automatically. I’m in the process of building more of a power history and I think the next step would be to develop seasons
That looks cool! What are you using for the template, it’s similar to one I’ve been wanting to use on my own site
Python guy checking-in here. I focus primarily on data analytics and have deployed simple front ends using plotly / flask / MySQL. Love the project!
I’m thinking about doing something around the power duration curve. Specifically modeling something similar to what you see in WKO.
Awesome, welcome to the club! I’m not sure if I’ll dive into modeling but if you happen to put together a way to do it in python, definitely feel free to post, I’d love to give it a try
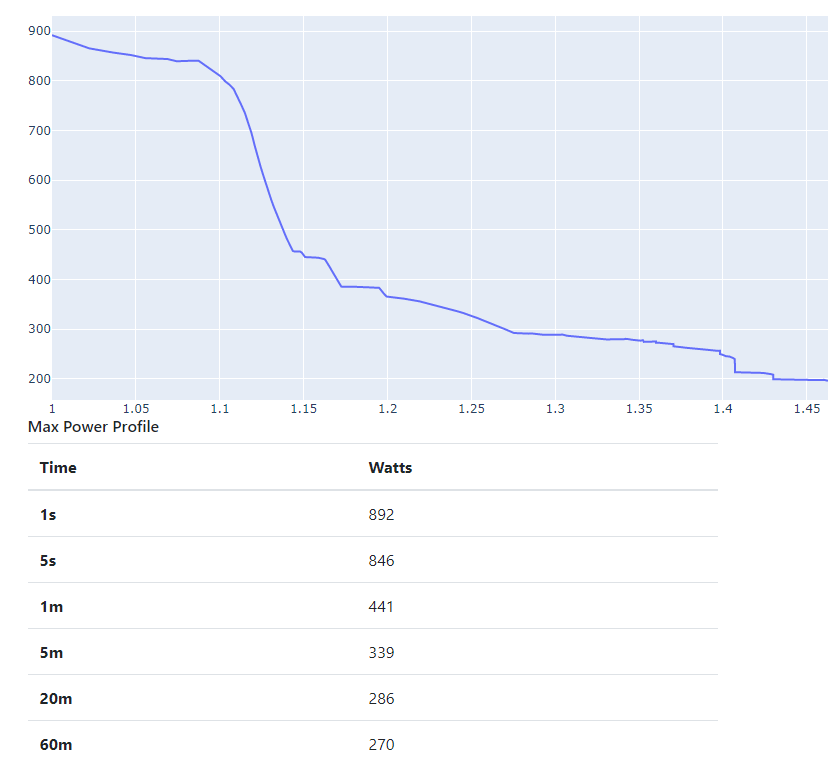
Finally refining my power curve after spending some time making my temporary calculations into a permanent model in my Django site. Had to mess with a logscale calculation a bit to get the curve to look normal, so the x-axis is still off while I convert that, but I also made myself a max power profile table
Bit late to the party here!
I would use Dash + SQL Alchemy personally. I very much dislike Django. It’s bloated and over complicated!
I’ve gotten accustomed with Django, and it works for what I’m doing as far as using it as the backend and frontend. Personally, I’m finding both Plotly and Bokeh to be limiting as far as what I want to do with charting (it does the basics but both are limited as far as giving data on highlighted segments like TR does with their ride analysis). I would have more options using django rest framework and another charting solution, but that’s going to take a while for my slow mind to figure out lol I’d like to polish up the interface a bit more, so I’m going to look into it
This past week I actually decided to make use of my raspberry pi to host my django site. The Pi serves as a plex server and I set up apache on it for light self-hosting, and fiddled around to make django work with apache, so I’ve got that going (as well as a domain pointed to my pi’s IP address). I was trying to get postgres on my pi but was having a hard time getting that going, so I’m using the one hosted on my PC for that.
another update for any folks still following/stumble upon this
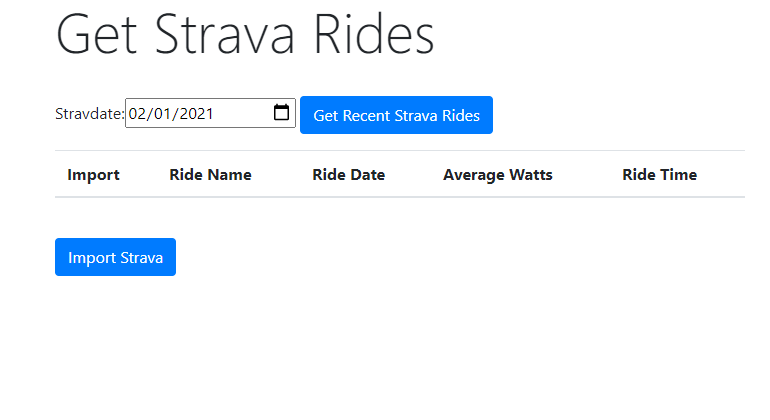
added a small but neat addition to set a date range (at least a start date) to get a list of strava rides. I had previously just hard coded 1/1/2020 when I started, but this gives more flexibility in the event I ever open this to others to use.
I am sure this has been answered above, but any tips how to use the authentication in python for strava? Is there a simple way? I just want to play around with my own data.
this is what I do, I use a python library called stravalib to help with this. At the end I save it to a Django model in a postgres database, but I also had it set up initially to just save to a json file when I was just doing pure python. Hope this helps!
def getstravatoken(request):
if "stravaauth" in request.POST:
    client = Client()
    strurl = client.authorization_url(client_id=yourclientid,
                           redirect_uri='your redirect url', scope='read_all')

    return redirect(strurl)
else:
    return render(request, 'PMC/stravaauth.html')
return render(request, 'PMC/stravaauth.html')
def authorization(request):
url=request.get_full_path()
parsed=urlparse.parse_qs(urlparse.urlparse(url).query)
code=parsed[‘code’][0]
client = Client()
token_response = client.exchange_code_for_token(client_id=yourclientid, client_secret=‘yoursecret’, code=code)
tr=pd.DataFrame([token_response])
st=StravaToken()
st.user_id=request.user.id
st.access_token=tr['access_token'].iloc[0]
st.refresh_token=tr['refresh_token'].iloc[0]
st.expires_at=tr['expires_at'].iloc[0]
st.save()
lovely I have been looking at that library, I must of screwed something up before hand! lol
question is…do you need to save it to a db? I am just hoping to return something as json before I start building myself a UI or something?
I did save to json initially, as an example, here’s some older code where I open the token from a json, refresh the token if the token expired and write the new info into the json
with open("stravtoken.json", "r") as stravtoken:
tokendict = json.load(stravtoken)

if time.time() > tokendict['expires_at']:
    refresh_response = client.refresh_access_token(client_id='id', client_secret='',
        refresh_token=tokendict['refresh_token'])
    access_token = refresh_response['access_token']
    refresh_token = refresh_response['refresh_token']
    expires_at = refresh_response['expires_at']
    with open("stravtoken.json", "w+") as json_file:
        json.dump(refresh_response, json_file)