Thanks! I am planning to re-work the “best power” achievements soon. At the moment these are only calculated for the durations you are tracking. I am going to change this to look at any time the power curve goes up or out for the season and show the delta on the ride power page.
Hey David,
And chance you might add a “raw watts” chart/distribution along with the current W/kg info?
For flat landers and triathletes raw watts is also interesting to look at.
Thank you!
Where do you want to see that? The “age group” power rankings can be toggled between watts and w/kg in “Options”.
Hey David,
Absolutely loving your work. The power charts with age categories etc are just superb.
I’ve long thought the original power chart missed the single most important metric for determining race wins. 15sec power. 5sec power is interesting, but the average finish sprint is 15 seconds. This is an important metric in real life racing and as many are learning now, it’s a vital power duration in Zwift racing.
Would it be possible to add 15sec into the chart, or like you’ve done elsewhere let the user select durations?
Wow, that’s exactly what I was asking about and it’s already built in there. I can’t say why I never saw it there before but it’s great! Thank you!
![]()
Go to ‘power’ click on ‘best efforts’ and add ‘15s’ - job done ![]()
Thanks! I have added 15s to the rankings but can only deploy it tomorrow AM (GMT+2). Lots of people on the site right now.
Cheers, I’ve already done that. I was asking to have it added to the power rankings in w/kg compared to other users on the platform. Sounds like David has added it now.
Question regarding the fitness tracking for the future.
I have my training blocks planned out until the end of October. Following this progression starting today:
Last 4 weeks of SSBI MV-SSBII MV-SPB MV-Century MV
All of these workouts and 4 pending races are on my calendar on the intervals.icu page. The only thing that sends me into the ‘Optimal Training’ area are my 4 events due to their large TSS(100 mile days)
Having done some structured TR plans in the past few weeks, I know from experience that most weeks will leave me feeling anything but ‘Fresh’
Thoughts?
I think it’s important to keep in mind that a lot of these CTL and TSB suggestions are from pro/elite riders and the training loads that are important for road stage races and grand tours. With life, family, etc stress I think it’s pretty difficult for the average person to have a consistent -15 - -30 TSB, even during loading phases. And it’s made even more difficult because you are most likely training with a majority of high intensity intervals so that is where a bulk of your TSS is coming from. Where a pro road racer won’t be getting a majority of their TSS from the 1 hour of VO2 intervals they do but from the other 2-3 hours of aerobic riding.
For people who are increasing their training load through intensity rather than volume the traditional metrics may not track as well.
EDIT: Also, I’m not a coach or anything so someone can feel free to tell me that I’m wrong but this is my impression from the past couple years of TR plans and the reading/listening I’ve done.
TrainerRoad’s traditional base 1 is all aerobic endurance (a lot of 60-70% FTP workouts), and traditional base 2 adds some tempo work. I did mid volume traditional base 1 and 2 starting late August 2019 after taking a couple months off. Some shuffling and missed workouts, here is my PMC:
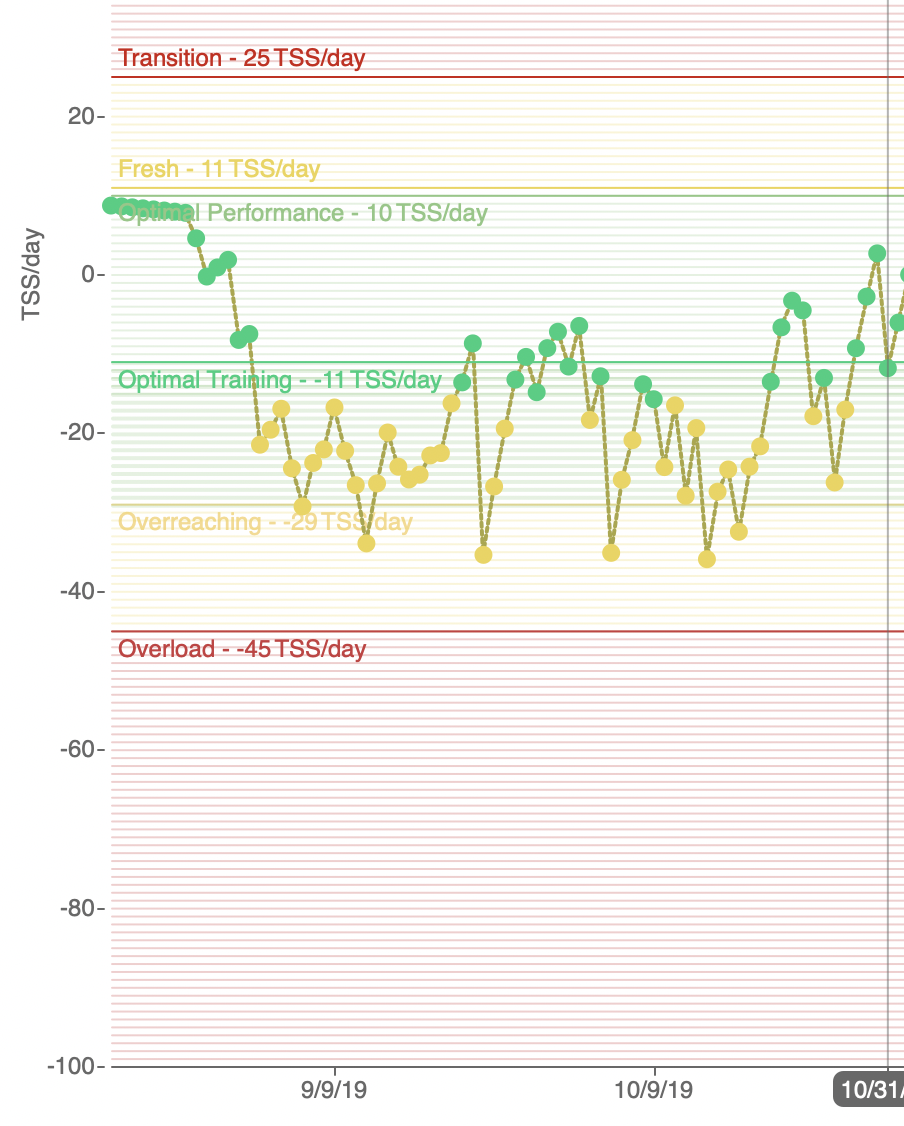
That was very easy base development and I generally stayed in -15 to -30 TSB range except for recovery week and then work related missed workouts. Wanted to show the “low intensity” base option as most folks do sweet spot base.
p.s. most workouts done outside, so I believe TSS per workout was a little higher than TR plan
Cory.Rood:
If you increase your daily TSS at a [more or less] constant rate, then your training stress balance will gradually become increasingly negative [ie, move down into the green zone on intervals.icu charts]. But this can be quite slow.
Suppose for example, that your current TSS, ATL and CTL are all about the same – ie, you’ve had a long period of roughly constant TSS/day. The you decide to raise your TSS by one per cent per day [~ 7%/week). After 6 weeks, your daily TSS would have risen to about 150% of your earlier, long-time constant TSS. That’s a pretty big increase in workload, right? Your TSB would still be only -9 [grey zone].
After 10 weeks your daily TSS would have doubled over its earlier, long-time constant value. A massive increase in load. But TSB would be -12 [only just in the “optimal training zone”].
Lesson 1: long steady increases in workload take a long time to get you in the “optimal training zone”, especially if you intersperse recovery weeks and rest days. To get into the green zone or red zone, step up your workload really quickly – of course, you can / should only do that for a few days unless you are on a tour of some kind [and even then, you need to recover afterwards].
Lesson 2: the “optimal training zone” is probably not something that mere mortals will spend much time in.
I had a suggestion from @Steve_Neal to make the form zones percentage based and use TSB * 100 / CTL for the form chart. I am going to add an option for that soon which should make it more useful to people who don’t train all that much.
Who came up with the “optimal training zone” idea in the first place? That’s not something I’ve ever seen from any of the original PMC experts?
Someone suggested I find a way to add it to Intervals.icu and I found this post (not sure if Joe Friel originated the idea but he wrote it up nicely):
Joe Friel, although when taken out of his original context (managing load throughout a periodised plan across a season), it can be misleading. Without that context, “optimal” as a label likely tricks people into constantly feeling like they need to maintain a TSB deficit.
Xert takes a similar percentage based approach where it doesn’t recomend you take your form below -30% of the Training Load. The constants are different to the typical numbers used in the PMC and they also split things up into Low, High and Peak stess. but the principle is the same.
Mike
That’s interesting. Without giving too much away about his methods, I chatted with Steve about CTL and a lot of his training schedules would not give athletes a particularly high ramp rate - although he has clearly coached a lot of very successful athletes.
This is also true of polarised models, unless you’re doing a really high volume of low intensity riding. I did a couple of weeks with 10+ hours polarised training including 2 vo2 sessions per week, and my ramp rate was only just over 2.
Edit: question, if TSB is turned into a percentage of CTL, what would the parameters be for “fresh / overtrained etc”?
I asked Steve that ![]() The chart in Joe Friel’s blog post showed CTL of between 90 and 100 or so for the example ranges he gave so I could use CTL around there to get percentages from the fixed ranges I have now.
The chart in Joe Friel’s blog post showed CTL of between 90 and 100 or so for the example ranges he gave so I could use CTL around there to get percentages from the fixed ranges I have now.
Makes sense. Just on personal experience, I would think about using more like the lower figure (90) as a base line.
I’ve been increasing volume and found myself often in the green zone for the last 3 weeks with fatigue but nothing close to burnout (in fact just tested an FTP increase). CTL went up to 84 max. Highest TSB/CTL was 0.46 which would suggest massive overtraining, but to me seemed fairly normal for end of a training block.