I’ve seen this commented before but I’ll be damned if I can find the thread.
Past couple of months I’ve been doing more, not massively more but I’ve done 3 100km rides (first long things since my mum died) and started the midweek club “tear your legs off” 2 hours rides again.
As such my calendar is all red and yellow, however, I’m fine and doing most workouts bar a couple work got in the way, and a week commuting home (10km each way) when dog sitting while dad is in hospital.
I’m wondering how long before AT realises I’m handling it, I know ml can take multiple inputs so it’s not a defined timescale but was just wondering.
I’m training for Half Ironman. Have been for ages. I get a yellow day every Sunday and every Monday. I do long ride Saturday (3-4 hours) and long run Sunday (1.5 hours). I rarely get a red day any more.
You can adjust the setting in plan builder to a more aggressive setting if you want.
I don’t know if it affects RL/YL but you can also do a volume check.
In my experience about 6 weeks but may vary by user.
My understanding is that RL/YL is not necessarily for TODAY but rather long term. You may be fine now but fatigue may build up over time in the months to come. I do think sometimes the AI approved ramp can be conservative so if you are handling it fine and building up gradually it will likely adapt. That said… I have noticed that it doesn’t like big spikes or hero rides. So if you are used to averaging 75-100 TSS then hit a 300+ day it is likely to trigger it, even if it is something you do regularly.
That’s right @Jolyzara 
Our fatigue management system monitors your training to help prevent long-term fatigue.
Our fatigue management system doesn’t tell you if you can do today’s workout or not, in fact, you could complete a workout perfectly, but if you push past the boundary of productive fatigue, it will recommend adaptations to keep your training high-quality and consistent.
There’s no exact time as to how long it will “read” that you can take on a certain load, but rather, as you train, recover, and get more fit, the amount of stress you can productively manage changes, and so will the Yellow/Red days naturally follow.
Think of it like spending on your credit card when you’re close to your limit. Every workout has a cost. Yellow and Red days are warning signs that you are spending too much. If you are spending too much, you have to adjust your spending habits to get back on track.
The truth is that there is a productive level of stress that will gradually make you faster, versus an unproductive level of stress that can derail your training. Recovery is the only way to offset fatigue, so our system’s aim is to keep your level of stress that will gradually make you faster, instead of overdoing it and having to take longer recovery periods that can derail your training.
That said, these are recommendations you can accept or decline, and you can always adjust the training approach to be more aggressive.
1 Like
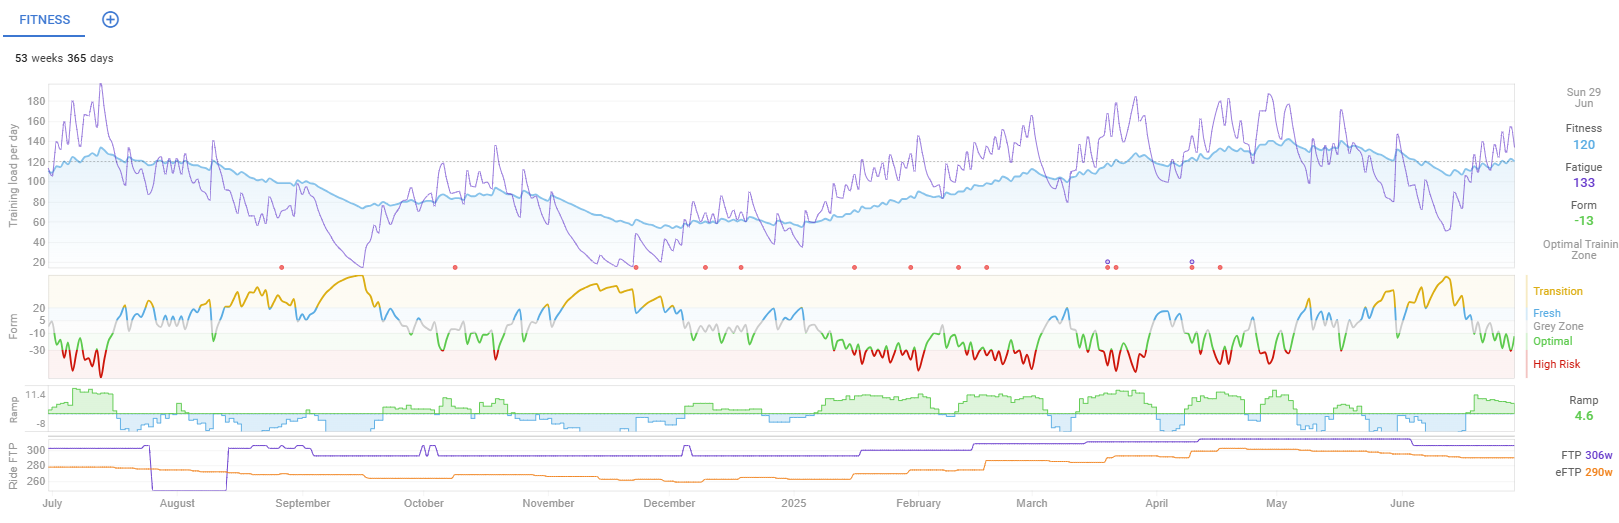
As already stated, it’s hard to estimate the time required since there are a lot of moving parts. If you want a little more insight into managing your training stress over time, you might take a look at intervals.icu. It’s an online tool that uses the common training metrics (TSS, CTL, etc.) to provide a nice visual on where your fitness is tracking vs. fatigue. It’s very easy to push/integrate all your activities into it via Strava or other platforms. While we don’t know exactly how the TR system determines red/yellow, I find that the intervals.icu system generally aligns. When my “form” goes into the high risk area, I’ll usually start seeing some yellow days in TR. And if I push deep enough into the high risk zone, eventually I’ll trigger red days in TR. Again, I’m not claiming to know exactly how the TR algorithm works, but the general concepts of chronic and acute training stress, ramp rates, stress balance, etc. are almost certainly going to be in play in the background. Intervals.icu just gives more visibility into what is influencing the assessment of your training state. In the graph below, you can see that I spend a good bit of time early in the season pushing into the red (where I’d be seeing quite a few yellow days in TR). And as my target events approach, training stress is leveled out and even decreased to shed fatigue (and no more yellow days in TR). Anyway, I think the red/yellow status in TR is a very effective tool and I love that it considers all rides (not just TR workouts). But I also like to dig into the “why” behind the scenes and intervals.icu does a great job of graphically looking at all the moving parts.