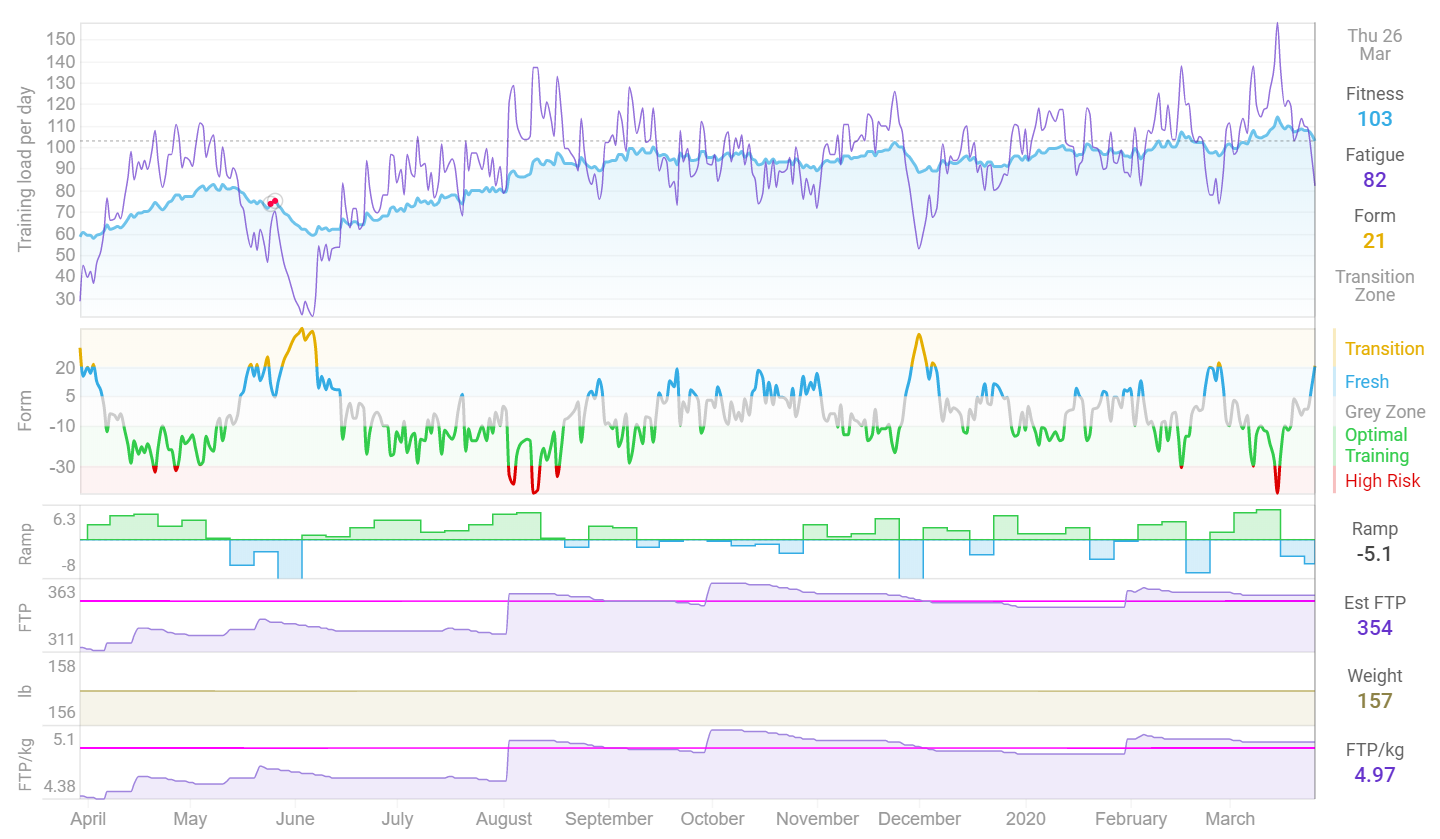
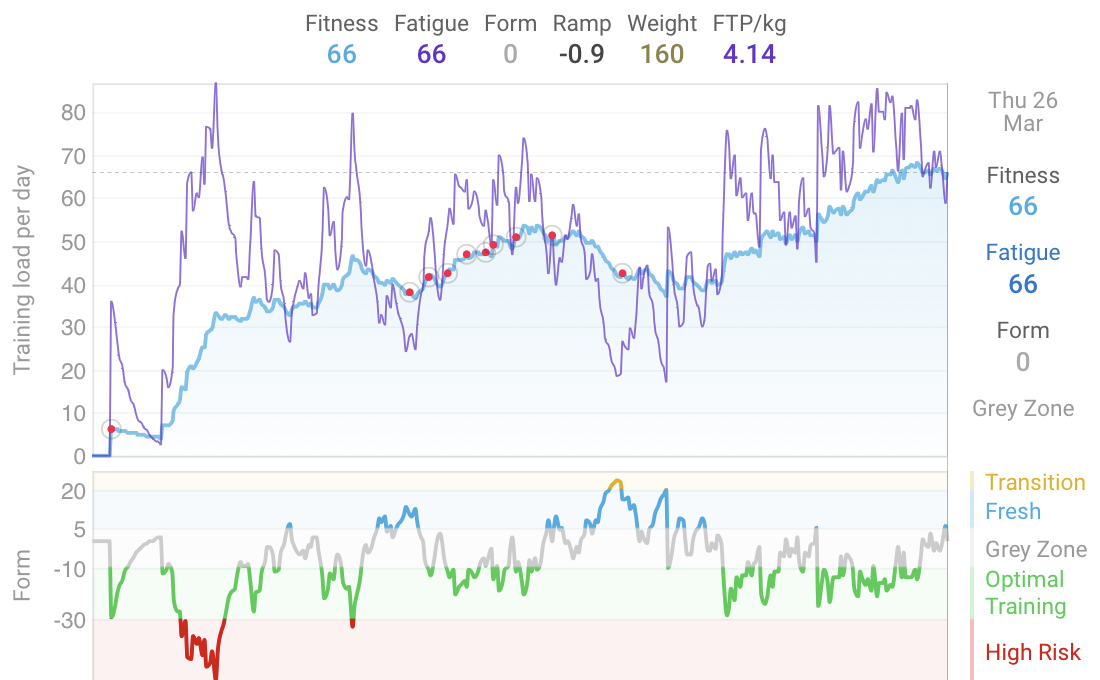
How’d you get the red dots on your form chart?
1 Like
Tx but I think I am going to just try get some time in and not worry about structure. We are going into Winter anyway and all the usual MTB races have been cancelled obviously. So I will just try to maintain some fitness and get back on it outdoors after lockdown. Can ride outdoors all year round here.
Those are activities tagged as races
1 Like
Very interesting curve to look at, with good insight from you; Thanks for sharing ![]()
2 Likes

This is one picture that’s not worth 1,000 words. ![]()

4 Likes
thanks!
Must be a ceiling though right? say, 0 to Merckx/Sagan or something
Okay here is mine.

One year in and my FTP has increased by 65%. This is my second time using structured training after a LONG break in 2018. It is a bit harder to see how life gets in the way of training and how you have to plan for Family events, Work trips etc.
Here is the same chart with some annotations
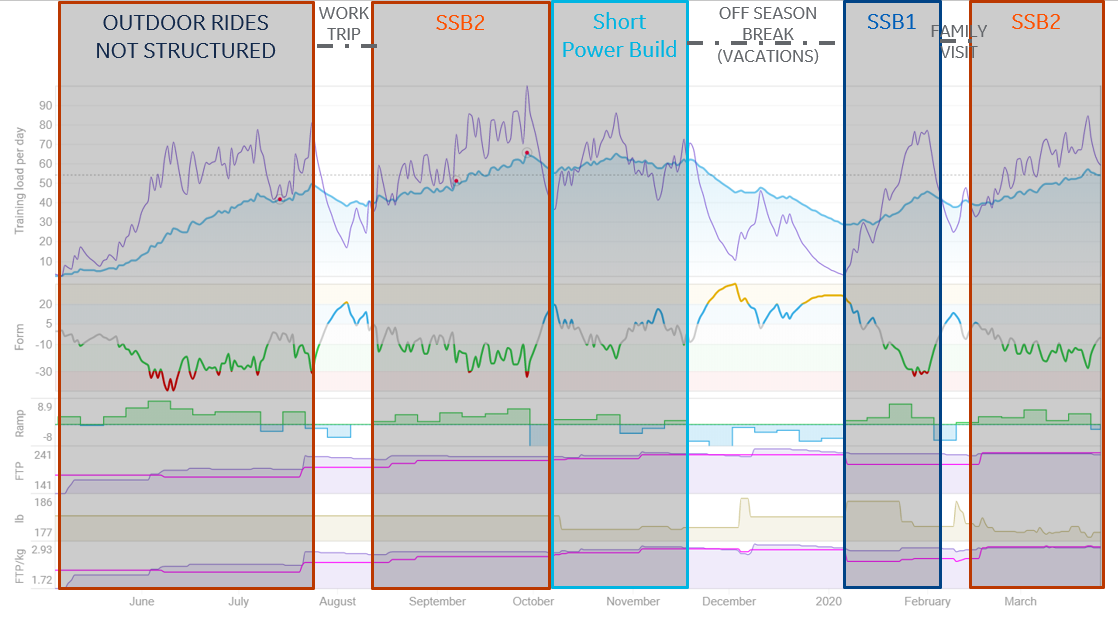
2 Likes
Looks like the Alpe Du Zwift course map ![]()
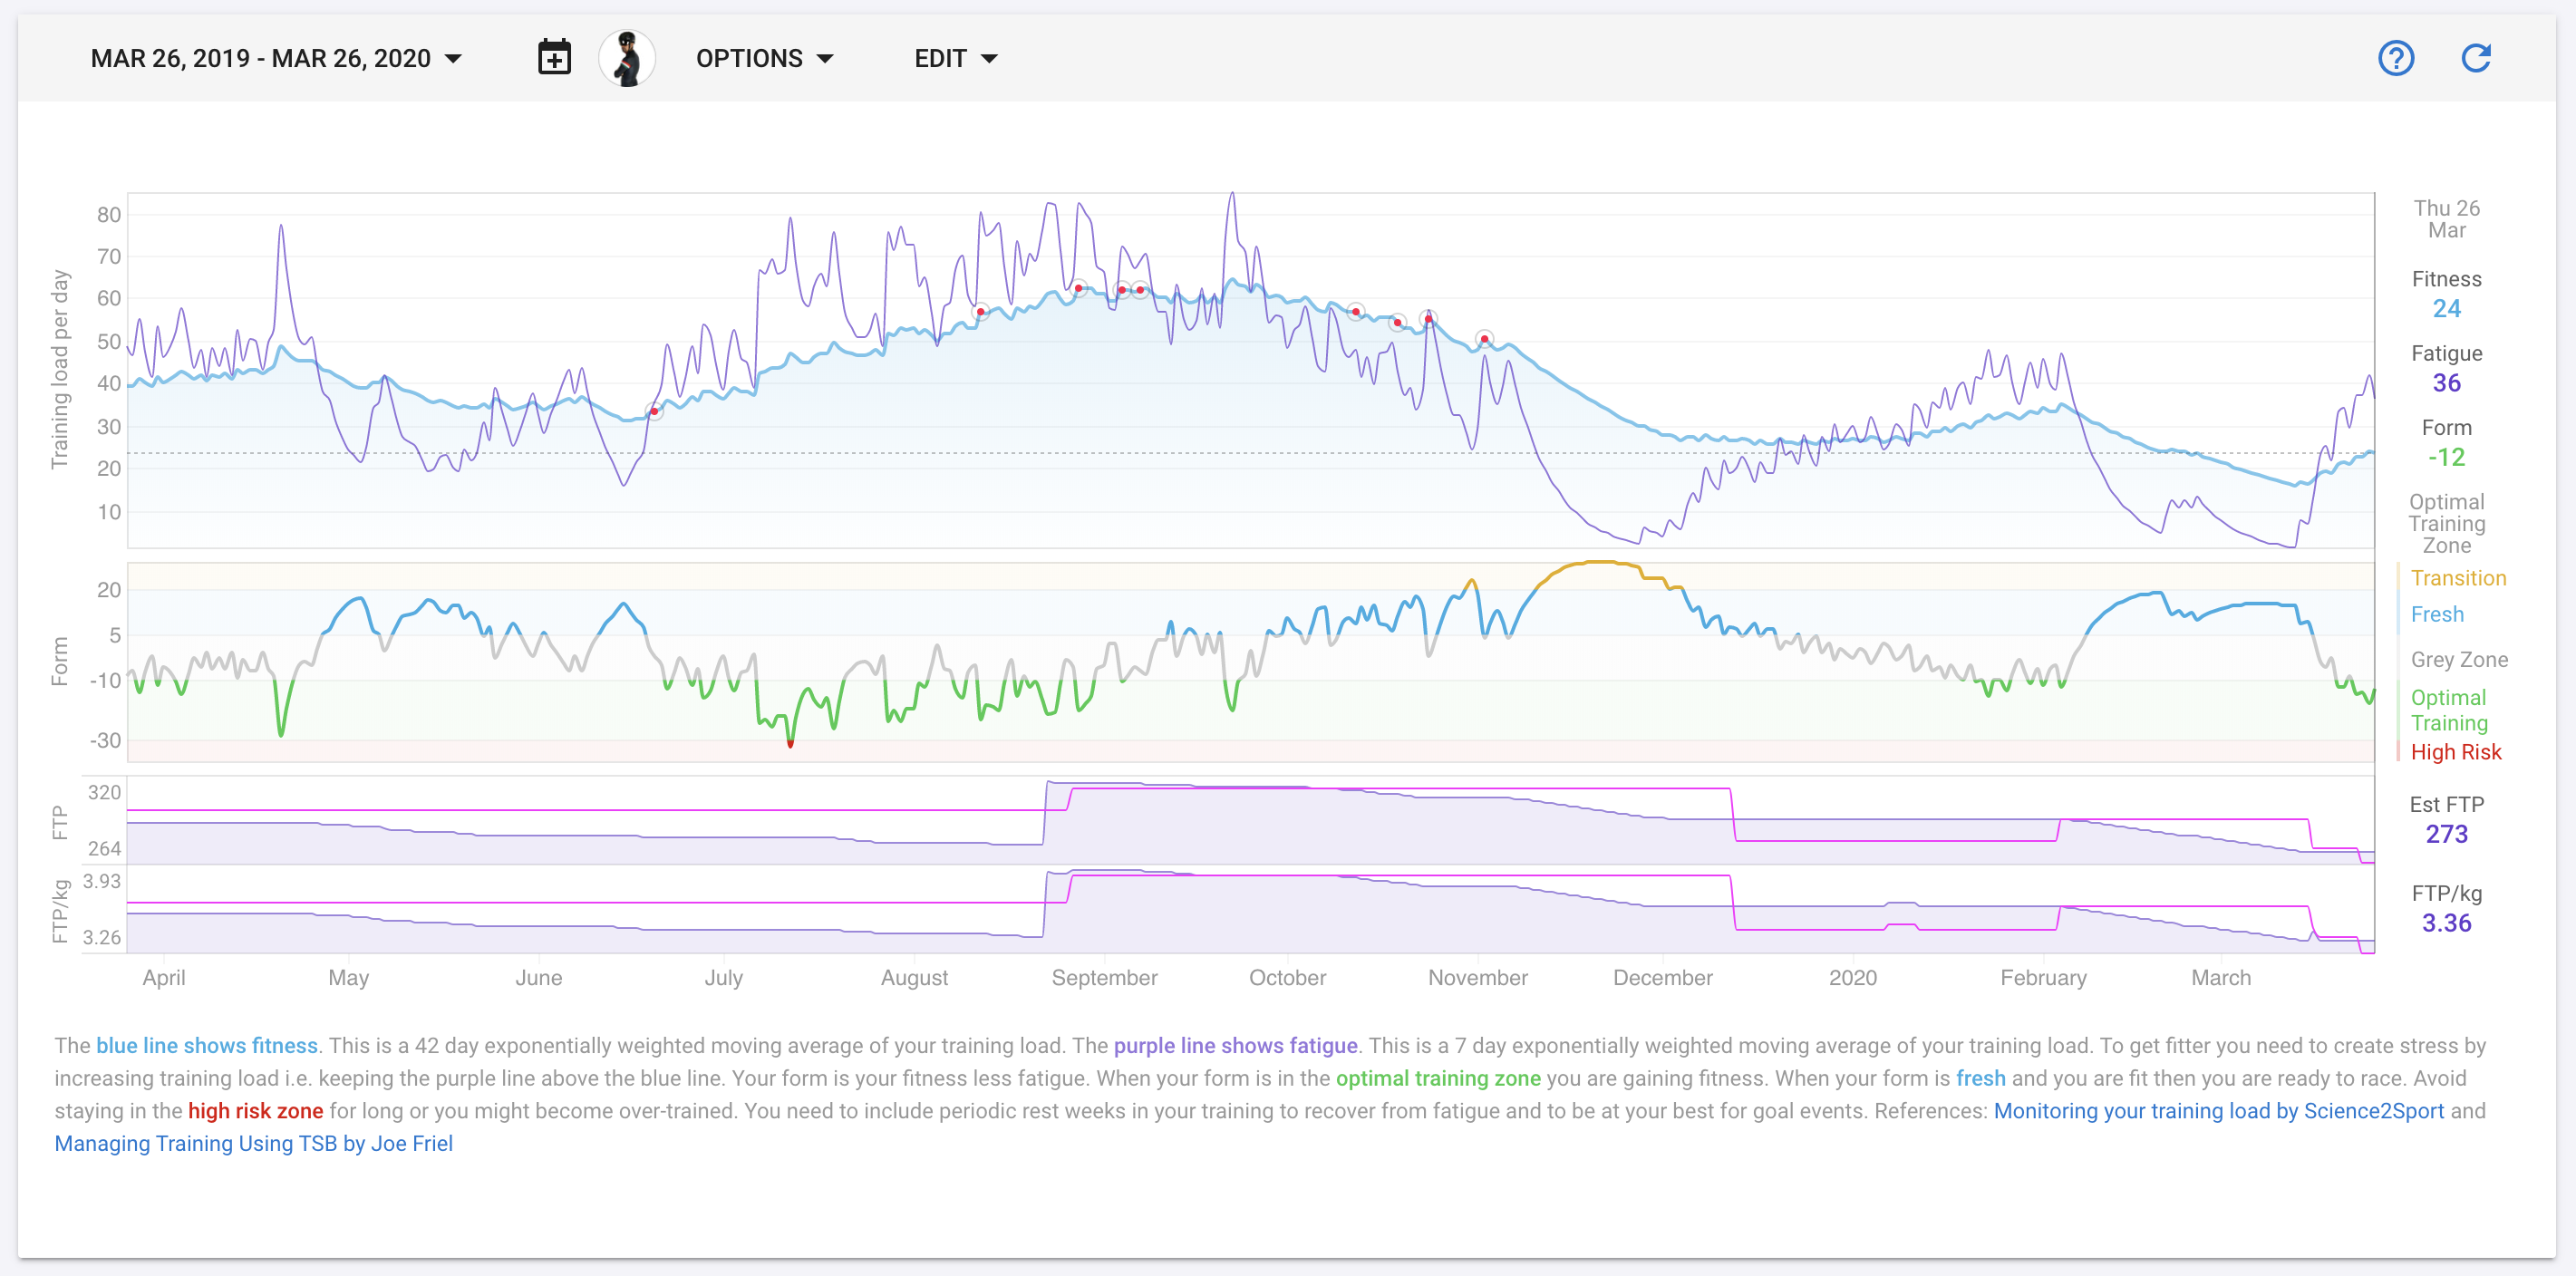
Within the last year I:
- Built up to my highest FTP ever (325 or 4w/kg)
- Got influenza twice between November and February
- Had surgery in the beginning of February
- Had strep throat in the beginning of March
- Lost 60w (325w down to 265w) from my FTP between September and today
- Have maintained excellent adherence to plan and structure
Lots of up and downs, mostly downs, but I’m optimistic that I will hit another peak FTP in time for CX season.
1 Like
All of the plans and “recovery” algorithms never really account for the bone deep weariness of a four day 1200KM Randonneuring ride. The fatigue lasts much longer than is shown in the chart. ![]()

Dinky little eight hour rides are barely blips in comparison…
5 Likes
Started riding my bike in May, started structured training in Aug. I’ve only been at this for less than a year ![]()

3 Likes
5 Likes
Wow. With no outside rides to mess up the plan, it’s very clear when your rest weeks have occurred over the past three months. You’re like a poster child. In a good way!
1 Like
Graph is 1 year, but last 7 months indoor after perfect plan, only forced 1 week early into a rest week cause of a mild flu (compared ro the usual manflu)
Easy when no races and travel.
1 Like
First time using intervals.icu… wow! Thanks @davidtinker!
I didn’t start using my watch again while running until last June, after a year away from tech. Started riding bikes in July and have been going strong since.
1 Like
Quick Photoshop job. But I guess you can add dots and overlay text in most phone apps these days
Really started with consistent training early summer of last year. Was trying a bit of a slower ram this year (slight dip once corona started impacting things and having to deal with life things over bike stuff). Back on the rise again. Looking to peak for the Utah and San Diego BWRs this fall.

1 Like
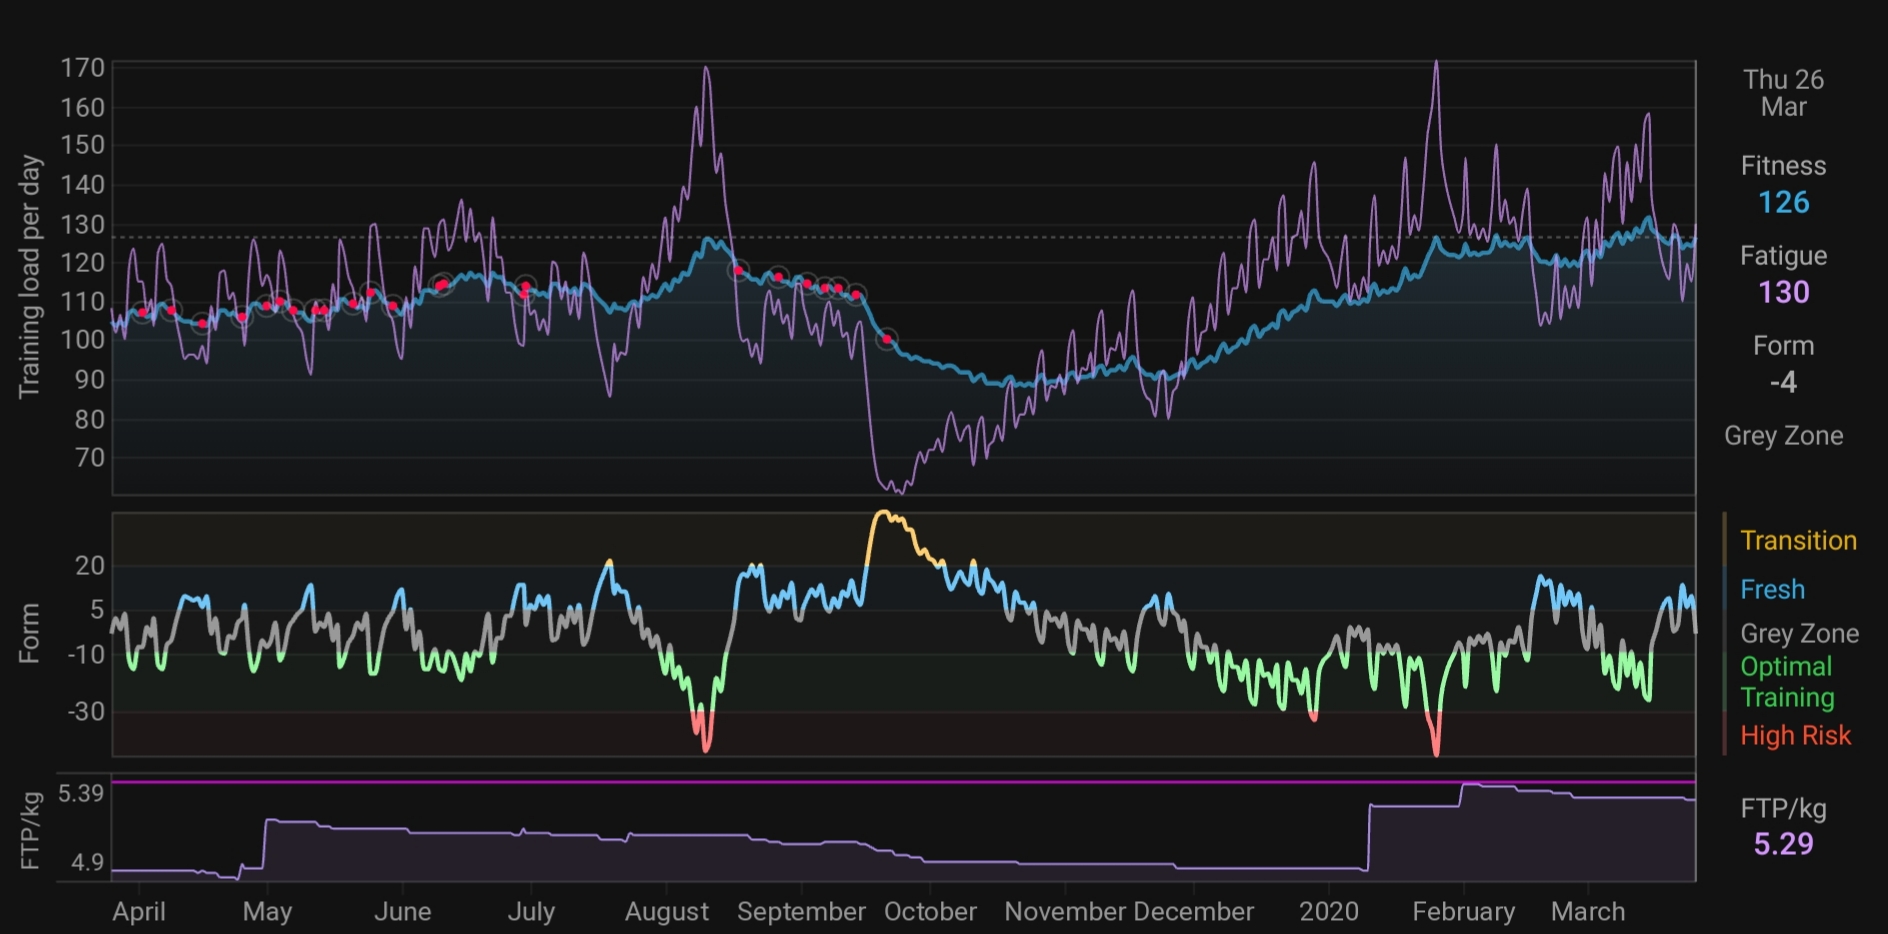
That’s a lot of daily TSS!