Thanks, it is a very interesting graph and it confirm my understanding of Keto diet impact.
I might I expressed myself badly but I meant by fat-adapted that I haven’t trained much endurance in the last year. I expect to do some gains there.
I’d like to confirm my feelings when doing the talk test. For the ones who have a Lactate meter, could you share how you feel around the inflection point (AeT) in term of breathing/talking and general feeling?
I wrote an entire podcast around this idea. What I didn’t put in there (because most people don’t have a lactate meter) is that the self-selected endurance pace I give to people coincides with LT1. Someone on my roster has a lactate meter and tested himself at about 230-240w for LT1 and it matched all his recent endurance rides. And it can shift a bit based on many factors. Hence why I don’t put a power target on it.
Thanks, I was wondering about that. It makes intuitively sense to me that if you set out to ride for “a long time” (but still with a sense of pushing on, ie not just idling), without looking at power or HR data or other feedback metrics, your body would automatically drift towards something that is metabolically easy to sustain.
What do you class as LT1?
I have a lactate meter and have done the following 10 minute steps using the ISM protocol at 65kg
160w - 0.8
195w - 0.9
230w - 1.8
245w - 2.9
260w - 4
LT1 for me which i have used 1 mmol above base line is
1.8mmol - 230w - 126bpm - 88% FTP
My normal riding endurance pace rides are naturally a lot slower than this (150-180w ish) and I do sweetspot intervals at LT1 (88%)
This is the point around you should train for zone 2. I don’t know what boundaries he considers for zone 2. It does not appear this is relevant to him. Train around the the first inflection point. That’s what he says.
The exact location of LT1 is very protocol dependent, and sometines the testers’ subjective assesment also plays a role. To enhance commensurability and ease of communication between athletes and coaches, here in Finland there is a national guideline for testers to use “lowest recorded value plus 0,3mmol/l” as the point of LT1. This protocol will set it fairly low, around fatmax.
San Millan’s model in fact seems quite similar to the Scandinavian bread and butter model that I have grown up with (not necessarily a polarised one, NB). Z2 dominates, lactate is measured to set zones and monitor progress; the amount and types of intensity used depend on event goals and training phase, etc.
Just listened to this again. Found the explanation about the increased oxygen demand when recruiting larger motor units interesting, because I think I just had an experience like that. I was out on a supposedly easy ride with friends that ended up being longer and harder than expected. On the way back home, I was pretty tired (and probably starting to bonk too). I noticed that my breathing wanted to be fairly heavy, despite both power and HR being in the endurance range. Could that be due to the recruitment of more motor units? I’ve been wondering about it, but didn’t realy have a good explanation.
Glycogen depleted? Increased fat oxidation? Which requires more oxygen for energy production than carbs. Hence, at the same intensity level you may breathe more.
Ah thanks, that was the other thing I was wondering about, if a chance in energy production system would reflect in oxygen demand. To be honest that sounds more likely. Thanks for the explanation!
It depends. I forget if I did but I hope I mentioned at some point there can be many more reasons for HR to drift. But in the absence of other things slow component is usually the best explanation. Dehydration is a close second, but if you were close to bonking then likely slow component.
Since I don’t know much about the rest of your training it’s pretty difficult to say. Diet can have a large impact on lactate as well, or sleep (lack of, particularly), stress, etc.
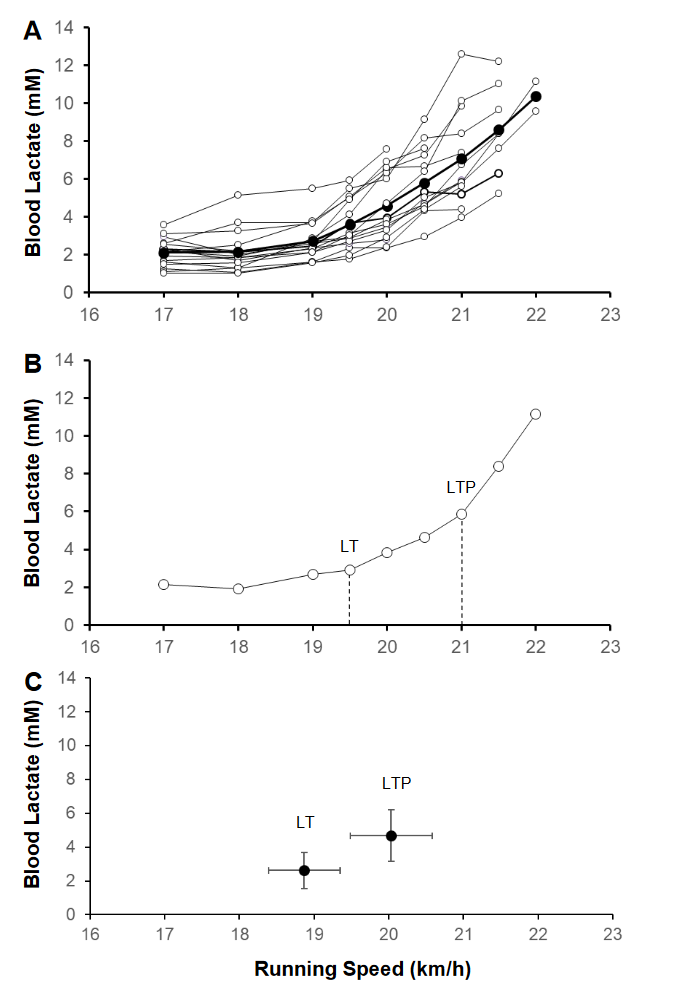
Only 3min steps but take a look at the variability (reminder: finger tested with Lactate Plus … finger produces slightly higher concentrations than ear lobe). Take home message: stop comparing your own absolute measurements to other measurements. Absolute concentrations differ!
However, as already alluded to in a previous post, the shapes of the curves look mostly very similar. Which means inflection points do not differ so much. This is also important when absolute values change between measurements for an individual (as it is the case for me). Absolute values may differ but inflections points remain comparable. Unfotunately, as I had hoped one could do just one or two measurements and build up a curve over several rides. Does not really work for me.
Still puzzling as it is known that the Norwegeans (triathletes and Ingbertsen brothers) use La quite a lot for intensity control during non-testing sesssion. As of now I don’t see how this would work for me.
Apart from that 4:20h logged today, plenty of happy-hard @LT1 riding. Love it:
furthermore on this study, this is taken from Alex Hutchinson:
But well-trained marathon runners are actually able to run the distance at a slightly higher speed than their lactate threshold. In this study, the runners hit their lactate threshold at 83 percent of VO2 max on average. Their critical speed, which is roughly when lactate levels start shooting up more steeply instead of just creeping up, occurred at 92 percent of VO2 max. Marathon pace tends to be somewhere between those two markers. In fact, a previous study by Jones and Anni Vanhatalo found that elite marathoners tend to run their marathons at 96 percent of critical speed, which in this case works out to 88 percent of VO2 max.
La above baseline at 83% of vo2max. “Normal” people have LT2/CP/VT2/FTP/what-ever there
Thx so much for sharing this. What i find interesting is the La value of their LT1s-~3mM. Could the higher values, compared to cyclists, be because the subjects were running and using more muscle groups?