I know. Jealous
1 Like
Yeah it helps, or doing a steady climb:
Kaweah 5x10 interval inside, best interval:

15W standard deviation inside with Erg, vs 25W outside on the 50 minuter.

22W standard deviation on a 10% climb with 1.5% decoupling on that 17 minute above threshold effort (we bumped ftp from 248 to 264 based on it), it was the second climb of the ride and I guess you could say after a 75 minute ‘warmup’ ![]()

Halfway between San Francisco and Lake Tahoe, in the middle of nowhere ![]() Included some excursions below sea level
Included some excursions below sea level ![]() because of the levees in the delta. Although I had to carefully navigate 3 traffic lights and 2 stop signs coming back into the city limits on the last 2 miles / 6 minutes!
because of the levees in the delta. Although I had to carefully navigate 3 traffic lights and 2 stop signs coming back into the city limits on the last 2 miles / 6 minutes!
3 Likes
I would suggest listening Tim Podlogar in this podcast. He is touching a lot of things which are discused in this topic…
3 Likes
Something called the Heart Rate Drift Test - based on HR Decoupling
Exactly! I guess that’s why no one in Europe is using this ![]()
And after many years I still don’t know what to do with this. From just a few days ago. LT1 HR is 137 bpm for me. I often observe higher HR in the first hour or so. May be related to age, it is often said that older folks need a much longer time to the get the engine up and running. I’ve noticed this in the last couple of years.

1 Like
I also don’t know what to do with. Here is a quick study on time to get engine up and running. Erg mode in the garage, first started at 5:33pm and the second at 6:00pm. Both at 64F / 18C. Average cadence of 85rpm on the first, and 84rpm on the second. Basically same conditions and cadence.
3 December 2019

13 December 2019

FTP at the time of 229W. Target 60% FTP = 137W.
Two different results. First one the HR started low and settled in about 20 minutes. The second one HR started high and settled about 35 minutes.
1 Like
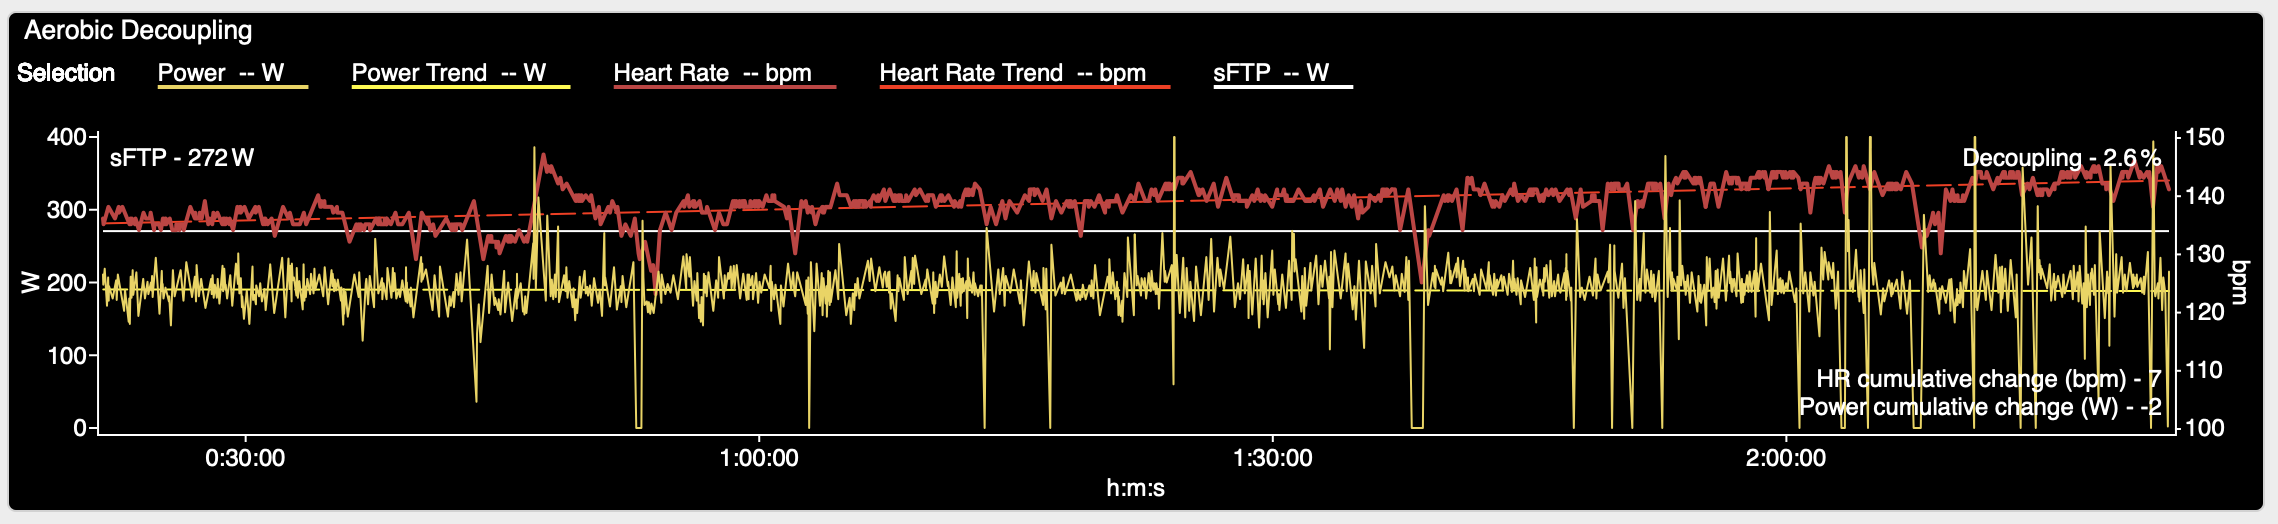
And tonight - 2 hours outside (.71 IF) after taking out the first 20 minutes and the last 10 minutes. Temp 50F / 10C and it was windy.

zoomed in on y-axis:
![]()
Here you can enter your lactate test (if you can provide it yourself) and check some results. Does not know how accurate it is…
1 Like
What does HR cumulative change mean? It’s 9 and decoupling is 0.9%. What do those numbers mean in that context?
Overall, is your point that you can’t get level, smooth HR response and therefore no value in attempting this type of assessment? If so that’s fair.
I see srykes point: if I can’t get HR to “settle down” (in a timely fashion, or at all), or worse, it goes in the reverse direction, then this type of thing would have no value. I think you’re saying same?
Dug this out to share. December 2019 v April 2020. After an LT1 block with some stuff. Stuff would be 100%-105% up longer hills. But not often. sensations at the time, best I felt on a bike in years.
Through the spring I carried on with LT1 but added more threshold and VO2 workouts. In August of 2020 absolutely crushed a 50 min MLSS test at 230w (230w at 7mM lactate steady state). Suspect if I had done a Kolie protocol I had more in the tank than 230w
Looking back at these data: 2 and 4 mMol points shifted nicely. LT1 did as well but the data are more noisy in and around 1mMol. So when connecting the dots in the graph it not as clear to me where to exactly put LT1. Doesn’t matter but adds to noise in discussion.
I definitely fall into the trap of staring at data and trying to be too precise with measurements that are not that great (hand held lactate and finger sticks have variability). But… as a guide to training, this is useful to me to get in the right ranges.
Enjoy!

4 Likes
How did you ‘assign’ your LT1 zone? Lactate test? Lab or yourself?
Nice overwiew, thanks. And what do you call an LT1 block? Is it a replacement for endurance rides? Mostly LT1 and no ‘easier’ Z2 work?
1 Like
Lactate - self tested - see graphs above. Those are my data.
LT1 block meaning I purposefully rode in and around LT1 with some “stuff”. I didn’t worry about progressing on a plan. Just rode 8-12 hours a week and kept things in and around LT1. Not scientific or overly prescriptive but worked nicely. Critically - it was enjoyable (fun) and I say as good or better than most plans I’ve followed.
Take all with a grain of salt. This is an N=1 period of time and I’m just one guy. We have no idea if there is a better plan for me or some superior approach. I just home in on the two factors of getting about as fast as historic bests and having fun doing it. As opposed to slogging through HIT workouts and feeling beaten down.
TL;DR Even if LT1 focused training is not perfect, worked pretty well for me and was fun too. Win + Win!!
6 Likes
Absolutely, and I think enough folks (this thread and elsewhere) have had enough time to run through a few blocks (or longer) of this “not endurance but not tempo” focused training (mixed in with other stuff) to demonstrate the benefits, even for riders on less time than 15hrs / week (I’m not sure there was a question of its effectiveness for riders who have generous time).
Because my improvements with an approach similar to, but not quite the same as strict LT1 focused blocks, my biggest question right now is “how precise do we have to be”? I know there are various schools of thought between either extreme:
- this rider/coach doesn’t even pay attention to LT1 or any lower threshold…it’s not a thing. doesn’t show up as a modeling artifact in my precious WKO/GC, don’t have a good field test, lactate sucks, etc. “just feel it, bro”
- I eat, sleep and recover at LT1. I can’t wait for real-time lactate analysis
I did similar for two years (and continue to do it, sort of) except it was in and around this lactate balance point concept, not the same thing as LT1. For me (and most riders), it is slightly (but not insignificantly) higher.
So taking a step back, LBP for me started about 5bpm over LT1 and then progressed to about 15/16bpm over LT1. In power terms, it went from .78 IF to .84 IF. Most ppl would read that and think sounds like you rode a lot of endurance and tempo. They would be right.
When I participated in Steve Neal’s website we saw graphs like what you posted all the time @DarthShivious. Most ppl are just happy to see the curve lower and extend and didn’t dig too much more into it (other than what steve told them). They recognized the value, did bunch of low but not too low intensity riding. It might have been prescribed in an overly-precise way, but who really knows.
TLDR; comparing your experience and mine: we did the tempo a bit differently (mine chronically harder). It didn’t seem to matter.
@DarthShivious Did you also capture HR? Curious to see what happened w/ HR around the 180/190 x-axis mark.
5 Likes
^^ ppl with naturally high anaerobic capacity, fast twitchy, model lovin’
^^ long course triathletes who haven’t been blocked by Alan Couzens
this is a joke guys. just a joke.
9 Likes
I like to think of lt1 to be mostly a range, we should probably think of lt2 as a range as well.
If you look at the old Norwegian hr zones, z2 starts around the inflection point of the lactate curve, and the very top of z2 is approximately 1 mmol above baseline. Z1 is below the first inflection point so this is how i set my zones for my garmin and on intervals.icu to match those original observational studies.
So this gives me 2 or 3 different intensities for endurance training. Norwegian z2 (between inflection point and 2-2.5 mmol), z1 (just below inflection point) and super easy 10 beats below the inflection point.
2 Likes
Is LT2 same as MLSS? Discuss!!!
I can define and test MLSS on myself, but LT2 is a complete mystery.
2 mMol is not LT1 and 4mMol is not my MLSS. MLSS for me is more like 7-8 mMol. Can maintain that level of lactate and steady state power at RPE 6-7 (10 scale) for a long time (>45 min when well trained) at a decent HR (85-90% HRmax) under good conditions.
TL;DR - What the heck is LT2 anyway?
1 Like
1 Like
Coming back to this, dfa1 of .75 was right at about 205 watts today. 2 days after my garage lt1 test showed first deflection at around 205-210ish give or take. Pretty neat how well they lined up for this one test at least.
3 Likes
That chart has a trend line (simple linear regression) and the cumulative change is for the trend line. On that graph the power trend line increased 4W over the 90 minutes, and HR trend line increased 9bpm. Decoupling doesn’t use the trend lines.
My points are a) is there really any value in using aerobic decoupling to cross-correlate with LT1 and LT2, and b) if you see low decoupling at various ‘long’ durations - long for a particular power zone - and across the power zones, then decoupling as a functional aerobic fitness measure has lost meaning/value.
If you have high (>5-6%) decoupling at endurance paced efforts, then there is value using decoupling to do more endurance work (per Friel, Uphill Athlete, other coaches on TP blog, and in my own experience). At some point the value in using decoupling ends. Personally my n=1 for decoupling is that it has best value for about 4-8 weeks after an off-season, and from time to time the rest of the year (seeing decoupling 3 or 4 workouts in a row).
1 Like
Agree and agree. It has also occurred to me that when I look at my numbers I might have also been training at or around LT (in the Skiba sense of the term) on those tempo rides. I just never thought about it because I’ve been conditioned to ignore CP, W’, and LT in favor of the almighty TP metrics. Never even knew what that particular “lactate threshold” was among the other trillion versions.
@Bioteknik Norwegian HR zones ![]()
Agree. I’m not sure either. But I don’t want to throw the baby out with the bath water. When steve had riders do tempo intervals and watch for both lactate and HR drift during the interval, it was informative. Mainly: dial back intensity with this session. Or, you’re not there yet overall…keep training.
Pretty sure no value there (RE decoupling). I’m definitely more interested in any value in knowing a “lower threshold”. FTP or CP is just fine for the other one.
1 Like