@Majoeric - those are great numbers, especially for a solo effort outside of racing. What’s your recovery like after that? I have a similar fuelling/hydration plan (although in fairness, I never get through as much liquid as I should). Strong work!
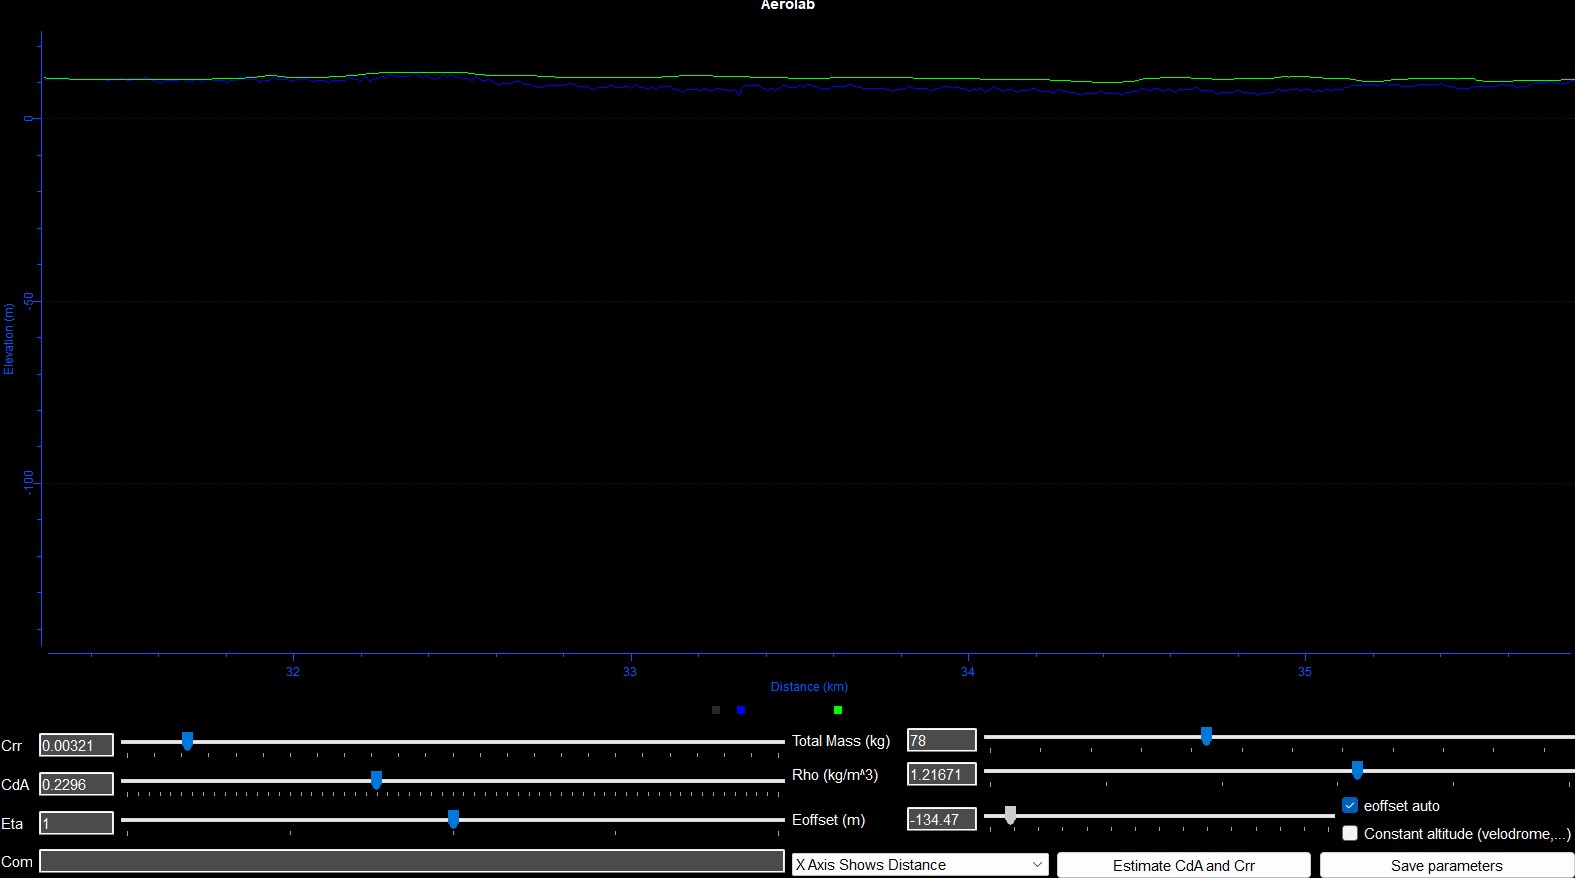
@Jamie_Berry - I’m using golden cheetah / aerolab (which is essentially Chung method, for those who maybe aren’t familiar). Therefore, the method definitely takes account of the downhill start. However, if you aren’t pedalling and you are holding a tight aero tuck that is not representative of what you can actually ride, then it will skew the figures, yep.
But 0.187 is a realistic effective CdA for you on that course & on that day. As above, my effective CdA was 0.164, and my “real” CdA (ie not traffic-assisted) is probably 0.18 or 0.185. So, the traffic effect seems to be about 0.015-0.02. This would give you a real CdA of 0.205ish, which for someone as tall as you is good. Having seen the photos of you, you are not in the “aero-as-fridge” category!!
If you want, you could try running aerolab for the VTTA 25 in Apr 2021 (which I did) and we can compare to see if the gap is similar?
@norman - I think there’s a good side-on shot of me at post #1147. Here’s another:
@PattyP - naturally, to check you have this right, you need to challenge the inputs. So, are you sure air density was 1.217, for example? (That is quite low). Are you sure that system weight is 78kg? This implies you weigh 65-68kg? Why did you pick 0.005 for Crr? That would suggest road surface is not very good or your tyre is not very good. By the way, I’m not suggesting any of these are wrong! Just, for this kind of analysis stuff, challenge is a good thing!
If you are happy with those numbers, then CdA should be OK, once the two lines in the graph match up at both ends. What surprises me a bit is that the lines are so flat. When I run the analysis, there’s always more up-and-down. Is this because your test course is very flat? And how long is it?
I think you’re definitely approaching it in the right way, @PattyP - and the way to develop/improve it is just to check the inputs and try different data, different routes.
It will be really interesting to see if you get an improvement after your TT fit, and in race kit. If you are a smaller rider (65-68kg) then 0.18 CdA might be a good target from where you are starting?
I’ve previously been using a combo of MyWindSock / BBS to back calculate CdA estimates but have just done using GoldenCheeta now. Levens TT returning values of ~0.18-0.19 which is reassuring. Also looked at the VTTA from last year and was ~0.21. Not surprised by the big reduction as VTTA was done in a tri-suit, IM position and just a set of 60mm’s vs Full TT set-up w/ disc, tri-spoke, skin-suit and a pretty crippling position
On fast courses doing a highly unscientific backwards iteration of Mywindsock (I know my average power and the time, it knows the weather conditions and I iterate back to get CdA). My CdA on the F2 dual carriageway drag strip comes out at between 0.19 and 0.21. On a sporting course I’ll get a CdA between 0.22 and 0.24. Aka aero as a brick Strava sauce will give lower numbers but it as it says is on the sauce
@PattyP - Really good point!! As long as your test route is a loop (or an out-and-back), you are mitigating for wind (assuming that a headwind out becomes a tailwind back). This can fall down on gusty days, or for routes where one part is very exposed to wind, and another part is sheltered.
I’ve run this analysis maybe 20 times, so I’m not an expert, but I can already see both a) a lot of consistency beween different routes and races, and b) days where there is a lot of wind, or gusty, the data isn’t as good. The ideal day for getting a good CdA number is an out and back route on a windless day with no traffic. But if you want to test whether A is better than B, you just need consistency - and several runs on the same route.
I got 0.184 for the VTTA event in 2021, so there’s a slightly bigger gap between our CdAs - which can probably be explained by the kit you mention above. I was in a very similar position/kit. The notes I made suggest there was very little traffic, and the air density was high!
So, I would definitely think your CdA numbers are believable!
@HLaB - thanks for sharing that, is the difference between your CdA figures just down to traffic pull? Or is your position slightly different? Interesting that you’re seeing a slighty higher traffic effect (0.03, versus 0.02 for me). I know we’re possibly getting into spurious levels of accuracy here, which just might not be very reliable, but its interesting nevertheless to think about how all this stuff impacts our aero, because that’s how we get faster, right?
if anyones interested, i did levens on wednesday, I’ve just looked at this on mywindsock, removing the start to the point where the elevation starts to rise again changed the approximated CDA from 0.178 to 0.182
I have rerun my data too (from 7th May) but the difference is much less; 0.1633 to 0.1638, give or take. I don’t think I can judge it that accurately, and I’d be more comfortable saying 0.163 vs 0.164 Probably tells me I am slightly more aero if I am coasting, which isn’t much use!! @Gaggy15 - was it windy on the day for you? That may explain the difference? I understand it was quite a slow day?
yes, reasonably stiff head wind on the way out. Hard to say with any degree of accuracy bit i would say worse than forecast which probably skews windsocks data.
i only looked into it as it had been mentioned, unless i’m field testing i don’t put much stock into it