I understand that part, but I mean taking the next step and using that to figure out TID. Figure out the different bottlenecks to see which other zones need training time to train the one you care about
Yes! @redlude97 posted a good resource, and many of the studies look at physiologic adaptations (e.g. changes in biochemical markers) as well as performance outcomes.
Couldn’t agree more. Even if you don’t count Sweet Spot as an intense day I’m unaware of any TrainerRoad plans that limit intensity in this way. I’m hopeful that the Polarized plans will limit intense days down to 2/week and at least be a suitable starting point.
Since AT doesn’t (currently?) change whether a day has intensity or not, and only adjusts the intensity of those days up or down it having a baseline plan with fewer intense days would really solve the gap you’re describing relating to ‘masters’ plans
3 Likes
That just goes into what changes not what the dependencies are. To me the body is a dependency graph (computer science definition) of systems where each node is a metric of a system of the body (mitochondria count, etc) and the edges are weighed to how much the node needs from another node. Training increases the value of node differently depending on what system it targets (what the training improves) but also depends on the existing value of existing nodes to see how much training is possible. (what you need to do the training)
A person training will generally only care about the values of certain nodes, the ones you need for the effort you are working for. TID used by the training system needs to increase those nodes directly but also looking at what those nodes depend on, the possible bottleneck. That chart from training peaks just says what nodes will increase based on the training but says nothing about the dependencies. Those dependencies are very important.
To expand on this, TR could take the zones of the different rides people do and calculate which nodes are impacted and then look to see how those impacted zones increase or decrease in power (your ability for the zone) to try and see if ML can detect the strength of the edges. This is also something that is only possible with a large data set. The small studies we currently have don’t have the sizes needed to find this. Creating this dependency graph would allow skynet to know better which nodes we need to improve and so what training we should do. So skynet would determine TID and not some general philosophy that is being debated here.
Thought about recovery so adding:
To include recovery into this idea each node would have two additional fields, short term value and long term value. Both values would decrease as a workout that targets that node uses that nodes power with short term being for during the workout (like MPA in xert) and long term for the longer recovery needed to fully recover and adapt (like the recover advisor on garmin). Thie decrease in those values allows for how an interval feels harder as you go (short term) and how much rest is needed after the session (long term). As long term slowly increases it would also increase the overall value of the node in the same way that rest lead to gains. The value would be useful in a graph in that if x depends on y if y gets used up x which depends on it has a bigger bottleneck meaning the useful value of x will be lower even if x isn’t used up. This should allow a better prediction of how your ride will be using the dependency graph.
Polarization Index (PI) = log 10 (z1/z2 * z3 *100)
PI = log10(z1/z2) + log10(z3*100)
PI = log10(z1) - log10(z2) + log10(z3) + log10(100)
PI = log10(z1) - log10(z2) + log10(z3) + 2
let z1% = z1 * 100
z2% = z2 * 100
z3% = z3 * 100
PI% = log10(z1%) - log10(z2%) + log10(z3%) + 2
= log10(z1 * 100) - log10(z2 * 100) + log10(z3 * 100) + 2
= log10(z1) + log10(100) - log10(z2) - log10(100) + log10(z3) + log10(100) + 2
= log10(z1) - log10(z2) + log10(z3) + log10(100) + 2
= PI + 2
The *100 in the original equation converts the z3 from a ratio to a percentage, if
it is already a percentage, the calculation is off by 2. This does not affect the
z1 an z2 percentages since the *100 cancel out
Therefore the PI% calculation should be:
PI% = log10(z1) - log10(z2) + log10(z3)
1 Like
Correction:
PI% = log10(z1%) - log10(z2%) + log10(z3%)
2 Likes
I think you’re missing my point. TID is an after effect of training the bottlenecks of the body. The only advantage of focusing on TID is it is way simpler
Thank you! That’s all so very kind of you to say. Hope you’re having a great ride!
Not really. Only the first set of bottlenecks, but the human body isn’t that simple, x depends on y which depends on z. You want to improve x but maybe it’s z that really needs the focus. Nothing really does that and with how many systems there is this is something machine learning would be good at. Plus I’m not sure we know all the edges in the dependency graph so ml could help with that too.
Xert isn’t machine learning its a different way of modeling your fitness. Complex model yes, and I think a huge improvement on that came before but it still depends on a traditional TID methodology of how it structures workouts. It doesn’t really train based on dependencies, so in that sense its like everything else.
@ambermalika since I know you’ve read way more research and understand it better than I do you have a take on this? Thanks
This is the whole polarized and other TID debate. If there was no dependency chain to worry about you would just train for what type of power you need as there would be no need to train other zones.
I was doing Gabb +1 while listening to the podcast. I thought it was very interesting although I missed parts of it as I was pushing through.
What impressed me most was @Nate_Pearson and @ambermalika just going through the studies and mapping it to Trainerroad’s thinking. No he said, we say. Just the data. I have always been impressed with @Nate_Pearson love of data. The amount of data Trainerroad has should prove or not prove the science.
2 Likes
Hi Amber, congrats on the podcast it is always such a pleasure to listen to you speak and how well you explain yourself and order your thoughts. Whether its a natural talent or hard work preparing your interventions, keep it up!
I like Trainerroad and its community and I have no doubt your plans make anyone fast if followed, however I have a point to raise to you guys (if it has already been answered I apologise).
I once heard Pete saying in the podcast that he likes having two hard workouts each week so he has full commitment towards them. And precisely here I do see a problem with Trainerroad for people like me that ride 6days a week at least 1 hr. One thing is being capable of doing 3 or more days of intensity per week, but another thing is if it mentally sustainable. I understand Trainerroad’s focous on indoor riding, but why not make a plan that can be followed either indoors or outdoors and limit the hard workouts to 2 per week, leaving the rest of the days as easy endurance rides. This is a more sustainable strategy for long term development in my opinion. Also, it would be top if the plans could be made compatible with group rides in the weekend, by for example giving some advice like if you do a group ride with this TSS wait so many days before the next hard workout.
Probably all this has been or is discussed to some extent in the podcast but I feel a lack of all of this points to be out of the box ready.
The Polarization Index is quite an interesting concept and I do love creating a graph, so I thought I’d try to show just what a blunt instrument it is on it’s own, by plotting a full range of Time Intensity Distributions that all have the same P.I.
Here goes - The graphs show the required Z2 and Z3 proportions for a given Z1 proportion to get the stated P.I. (Plotted from 100% Z1 to 0% Z1)


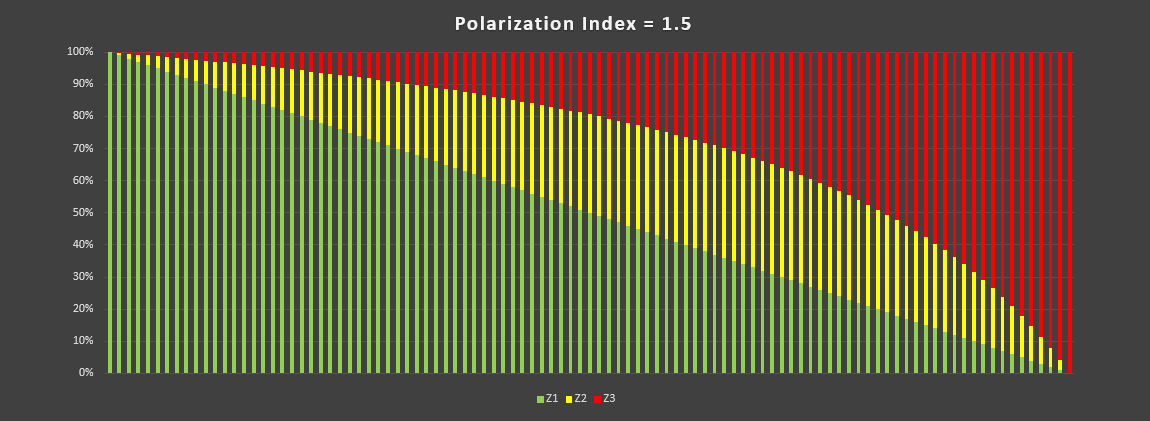

From those graphs it’s pretty clear that saying a training programme has a Polarization Index of, lets say, 1.5 doesn’t tell you very much about the distribution of the zones. It does tell is that there is a very good chance it’s pyramidal in shape but there’s also a good chance that it’s not. Once you get down to Zone 1 at 33% the distribution will actually be Threshold (33%, 34%, 33%).
And once you polarization Index is down at 1.0, you only need to have a Zone 1 at 44% for the distribution to be Threshold (44%, 46%, 10%)
Better to just plot the actual zone distributions rather than mess about with this in my opinion.
As far as the original graphic that was posted, what does get me about this was that, although a genuine mistake may have been made with the maths on this one - I don’t believe that someone who had actually taken more than a cursory look at the principle behind the equations would have realized that it was wrong.
It’s been said a few times in this thread alone that you need to read past the abstract to get a full understanding of what’s going on. That didn’t happen in this case.
Mike
15 Likes
So there is one type of training to target the weakness? I don’t know about WKO but I know Xert doesn’t do that, it uses a progression to get to a target (also they suggest you use a coach to better structure your rides) All of the training tools have progressions of different workouts to target a weakness. The whole debate in this thread is about types of progression. My whole point is that a progression oversimplifies what is happening A progression is training the bottlenecks in physiological adaptions but not in an optimized way as it ignores the details. Polarized, threshold and all the other TIDs are simplified progressions of the dependency graph they aren’t optimized in that it allows spending time training systems that aren’t a bottleneck.
The nodes of my dependency graph are the physiological systems so attempts to model how to increase the ability of the system you care about by also increasing the nodes it depends on.
(Granted the nodes initially may just be different power zones (could have overlapping zones) as there is probably a very high correlation with a zone and a physiological system allowing the model to stiff be useful)
Is that for everyone or just those in the closed beta?
everyone
1 Like
Xert trains towards an athlete you’re, there is still a form of progression in how they structure workouts. It does identify bottlenecks better then traditional methods cause not everything is a percent ftp
But it still has a progression

1 Like
@ambermalika As someone who reads the methods sections of papers often, I appreciate that the podcast delved into that part, had some spot-on critiques, and encouraged others to dig deep when evaluating the quality of the papers. From what I can tell the physiology research on this type of training started with a retrospective style, i.e. asking, “what are elite athletes doing?” Those older data were either based heart rate, if they had recorded it at that time, or session goal (hard or not hard). Literally some of the old studies didn’t have a Z2 since training days were just hard or not hard. I was shocked reading their methods at what they got published, but I guess athletes weren’t recording things the way we do now. So, they had mostly limited data. Then, the physiologists constructed prospective comparison studies between POL, LSD, HIIT, and others that were generally small in size and short in duration. Seiler himself says that prospective physiology studies are very hard to do (they will be short, the study population will be limited in size, and outcomes are only surrogates of certain types of cycling race performance) meaning that they generally will have questionable applicability to real world scenarios. But now everyone has a power meter and some sites like yours have access to massive amounts of data. What I haven’t seen happen is the same physiologists say, “in 2018-20 what did the elite athletes actually do?” And then go on to examine the power data and training hours from the seasons of 500 cycling pros, or 1000 cat 1 cyclists (or 5000 cat 2s with a job and 2 kids and 6-8 hours per week to train). Do recent large retrospective studies exist?
B I N G O
They were more concerned with “defending” the brand and ran away with bogus calculations that supported their case.
3 Likes
My takeaway confirmed my general views of any science that deals with incredibly complex topics like the human body: Every study and experiment is one chip off a giant marble block, where the ultimate goal is to carve a statue. As we’re still in the very early stages of understanding the topic all we can really do is try and guess at the final form of that statue, but there just hasn’t been enough science done to know for sure what it is.
For me, I’m going to keep following the TR plans and I’m still getting faster. I’m excited to try out AT and see how that works but I think it would be silly to switch to a different training philosophy based on even an avalanche of studies at this point unless you’ve been plateaued for a while.
4 Likes