The reason for long stages is that in short stages (say, 1-3 minutes)
you don’t know which stage (intensity) lactate is coming from.
In a 10-minute test stage you know that all lactate was produced in
that stage.
To avoid derailing the ISM thread on methods, we have discussed lactate testing protocols and some forum members have posted results in this thread. Have a look and do feel free to comment or add more data if you like:
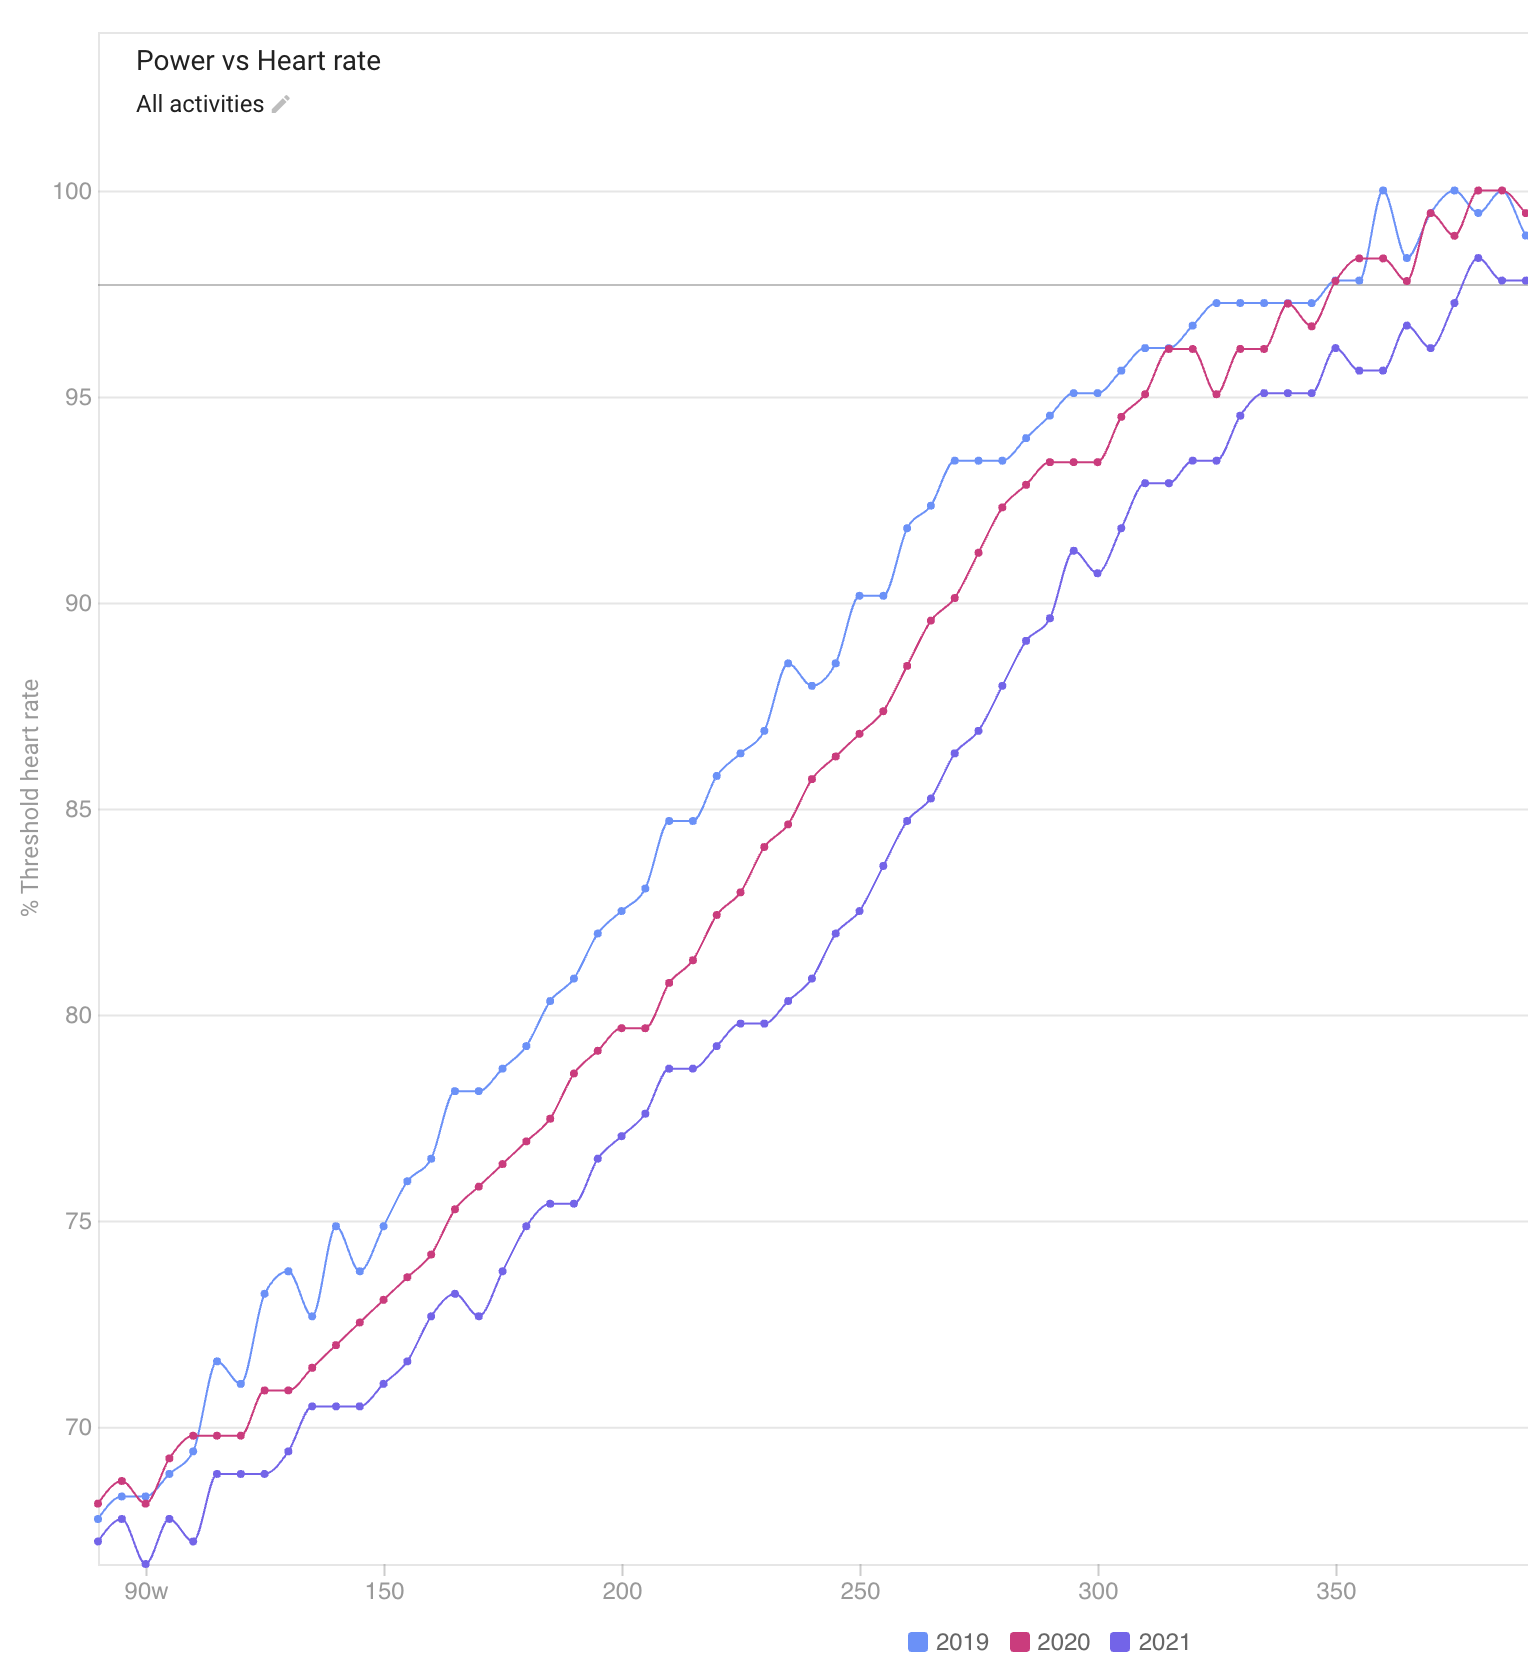
Here is some info from David T on how that chart is constructed:
Each ride has a power vs HR curve created by breaking the ride up into 1 minute segments, adjusting for HR lag and calculating average power and HR for each segments. These are the data points used for the decoupling related charts on the activity power page. Only segments with 100% moving time are kept.
The traces for the comparison chart are created by bucketing the power-HR segments for all matching activities into power buckets and averaging the HR.
2019 was a year with detraining from May-August, followed by TR traditional base 1 and 2 and finishing with an attempt at polarized. Laid the foundation for 2020.
2018 was a mix of TR SSB early in the year, with outdoor riding and a short block of TR’s traditional base in Sept/Oct
2020 transitioned to more aerobic development
2021 continued the aerobic development
2017 was peak fitness with a lot of work in middle zone and anaerobic capacity, starts diverging from 2020-2021 around 82% HRmax
Will be interesting to compare once a full year of 2021 data is available.
I’ve just done my own heart rate vs power analysis. What I wanted to look into is how my LT1 heart rate vs power differs for the first two hours of ride vs the second half. Drift is not considered in the respective i.icu plot (I guess).
I like that chart, but probably because my improvements are super obvious, although it gets super messy close to threshold with the inclusion of shorter VO2max intervals that drift through the threshold hr range.
I’m pleased that averaging close to 8 hours/week has delivered results. Mine looks better if I remove some years and don’t screen grab the short interval noise above threshold:
Just stumbled across this paragraph from one of Andy Jones’ papers on critical power
Decided to plug in my own numbers (CP 345w, 6min power 400w), which gave me an estimated LT of 290w… which is very close to what i’ve been seeing with my dfa-a1 testing.
Probably makes a good rule of thumb for those without lactate or HRV testing to nail down that ISM zone 2 power
My figures are 6min - 280W CP-. 230W which would put my LT1 then at 180W. Xert LTP has me at 183W and my DFA/A1 is around 185W. So it’s basically as accurate as the other methods at least for me then.
Not as impressive power as you, but a huge bump for me at where my LT1 is estimated to be (coach is in another country).
Been doing lots of z2, 1-2 interval sessions a week at max, 99% of the time only one. Averaging around 10-15 hours a week
Started cycling in 2018, just riding around, mostly in the city, 2019 was my first year actually cycling and looking at metrics, last year was a bit more riding, but got a coach in October and has been working with them since then, and gotten much stronger across the board, while also losing 8kg!
I can add that I started TR 2019, and did it through on and off into 2020, but constantly got burned out and got sick 5-6 weeks into the plan every single time…
I think that has been the biggest thing with having a coach, always keeping up with how I am feeling, lots of z2, moving effort days if I am feeling sluggish or such. This way I have been able to be ultra consistent as well as managing fatigue!
I figure I’d join in… I’m only adding outdoor pwr:hr since I have auto pause for tr workouts which can then elevate my pwr:hr ratio. I ride rollers and periodically stop since standing is more of a risk than the effort is worth so I give my butt a bit of a break every 15 to 20 minutes.
Lt1. Looks like in 2018 I was just never riding easy and was only at that hr during downhill and recovery periods. Total volume this year is quite low, and I have done zero intensity above threshold.
Interesting, this coach was coached by ISM for many years. He pretty much uses ISM’s philosophy in his own coaching now. However, he also cautions of too much “base” training. Similar to what J Vaughters once said. You have to touch all systems.
Very interesting, he speaks of tempo a lot. Also his description of how breathing should feel like in zone 2/at base matches pretty much how I feel. This is so different to all the Twitter-experts-who-recommend-nose-breathing-but-probably-have-never-tried-it-themselves.
I can relate a lot to what he says. My “problem” is that I have moved my AeT/LT1 so much to the right that it sits very close to my FTP/or-similar-metric. I’m happy with my AeT, I’m not so happy with my FTP/or-similar-metric. However, my only two races this year (probably) are ~12h each. Project for next season.
Yes, this was another great episode of what is a consistently excellent podcast.
Your point about LT1/FTP relationship was interesting. Given that a goal of LT1 training is to improve lactate removal, I would have thought this would have produced a shift for FTP (or whatever term) too.
Was all your LT1 training done at the expense of other levels?
Kidding aside, as you right shifted your LT1, did you notice that riding at FTP/MLSS seemed easier? In terms of RPE. That happened to me and I attributed it to working on LT1 and TTE as opposed to trying to drive up FTP (which is what I’d mostly done in the past).
The obvious magic sauce will be moving LT1 right, TTE out and then moving FTP up. Then repeating the cycle(s). Post in bold font when you figure out how to solve the whole equation!!
Yes, sort of. Started with the pandemic. Firstly, did a lot of no-man’s-land implicitly and then more structured after learning about ISM. At 18-20h per week there is not much room left for intensity. Once a week some stuff. Did two dedicated blocks though. The magical 105% FTP/90% MHR region. Can’t say it had any effect though.
But I’m already a more experienced rider, my context is probably very different to most folks in this forum.
Indeed, it appears Ben Day prescribes more intensity than others. I can’t say for sure if this Bike Exchange athlete is coached by him but there are some indications on the web. More intensity, more medio.
It seems like Ben Day’s zone 2 was a notch higher than what ISM prescribes. A few of things he said reminded me of the latest Magnus and Marcus podcast. Anyone listen to these guys?
In this podcasts they were talking about plateaus. When they get a new runner, they look for the kind of training the runner hasn’t done. They may find an athlete that never did long slow volume or one that never did sprint training. Giving the athlete their training weakness usually gets them off of their plateau and up to the next level.
So like Ben Day was saying, you have to hit all systems.
As usual, dose makes poison But yes, the question about how to keep all energy systems firing is an important one. I also think that the fiber type distribution or genetic makeup of a rider affects this equation quite a bit. In my experience, as long as I can recover, there is almost no detrimental effect of doing as much z2 as possible, but this may be because I have a relatively strong natural anaerobic capacity. So, if anything, it is beneficial to tone it down a bit. Then again, someone else might lose quite a bit of their upper end, as brought up in this thread.
My winter was not good: due to constant flus from my kids’ kindergarten I lost 1/3 of my volume or even more, and training was very sporadic. So I decided to cut out all intensity and do some of the z2 in the happy-hard z2/z3 region for the first time. Gotta say I am quite impressed thus far. Having done essentially no intensity proper since last autumn, I have broken my historic 4min best by more than 20w. Also there is minimal HR/power decoupling at the end of medium-long progression rides (eg. 1,5h happy hard to 1h threshold) that I have done the past couple weeks. Also legs feel strong at the end of such rides. Next week I will do a volume block and then move onto threshold and vo2. Have an A race in August.