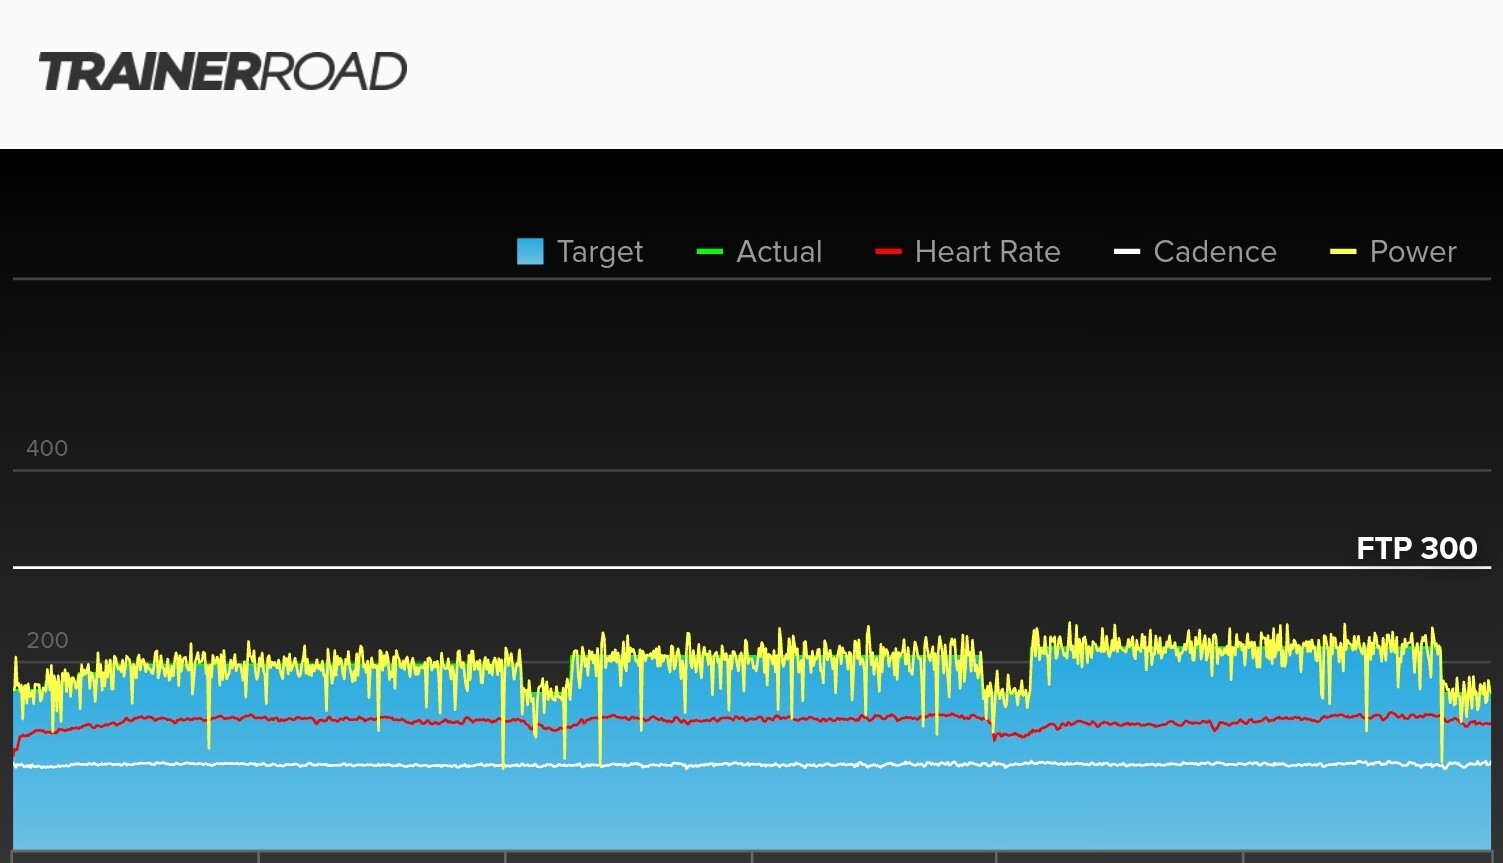
I’m using my 4iiii crank power meter (with a pretty fresh battery) to drive my Wahoo Kickr in erg mode. All on bluetooth too. I often find my interval average power to be a few % lower than target and there are typically low spikes, like in the pic here.
It may be related, but I find it takes a while to ramp up the power too. I try to stay consistent with cadence and let erg do its thing but it can take 15-30 seconds to get up to power for intervals.
I know the power graph won’t be smooth, but wondering if there’s anything going on here? Does this look normal for folks with a similar set up? Any settings I should be looking at?
Those large downward spikes seem a bit odd but otherwise not too crazy. Data smoothing makes it look like a perfect graph, when in reality, its probably closer to yours. There is some loss of accuracy by only having a single sided meter so that can account for some of it.
I think the power lag on the kickr is coming from the kickr and not your meter. I use the onboard power on my kickr and I get that sometimes. It was bad enough previously that I opened a ticket with wahoo and TR. Interestingly, the TR support was more helpful at getting my wahoo sorted out than the guys at wahoo!
I have a similar-ish setup. TACX Flux 2 and a Stages Gen 3 FSA powermeter. I do everything in ERG.
Ramp up delay differs depending on the type of interval and its intensity. Typically the delay is between 3-8 seconds. My interval average power is almost always 2-3 watts lower on sustained efforts and 10-15 watts on bursts. This is consistent and I’ve learned not to chase the efforts.
My onscreen graphs resemble yours but, I don’t see the large power dropouts.
I switched to a Kickr v4 from a dumb trainer (power match from a one sided assioma) this year and that looks pretty similar to what I’m seeing.
Had a conversation with support and they assured me all is good so I’m going to trust them and just pedal…
With shorter intervals, sometimes the interval avg is a few watts off, specially if it goes from 120 to 360 watts for example. On longer intervals, it’s 0, 1 or 2 watts off.
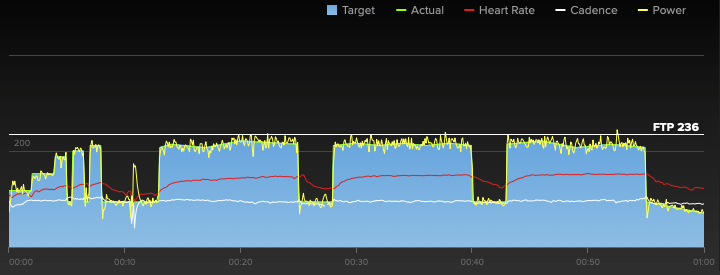
Ok…here’s something else weird I noticed. Wondering if this happens with anyone else. The drop outs seem worse the longer I ride. The second 25 min interval looks a bit more spikey than the first. I took a restroom break before the third 25 min interval and there were fewer drop outs once I started up again, but then got a few more as the interval progressed Bluetooth signal strength from my 4iiii powermeter varies from 2 to 4 bars and I have no idea why. Would it be worth trying ANT+? Maybe a lithium CR2032 instead of a cheaper one?
Might be the zoom level and graphics display related to pixel count, but those don’t really look like dropouts. Can you zoom into one of those block to show a smaller range of time and the greater power graph detail?
Hope this helps…tried zooming on mobile with questionable results
The first pic is from the second long interval. Perhaps drop out isn’t the right term, but there are many low spikes <100W when the target was roughly 200W.
Yeah, I would not call those “dropouts”. That term is usually associated with a total loss of data for a period of time.
Those are notable low values/spike, but I am not sure what is driving them. Sounds like you’ve basically covered the battery, although using the better type might help.
I do think it’s worth a test on ANT+ if you have that option. Seems BLE is most recommended, but I know some people still have better luck on ANT+ with their situation and noise in the local environment.
I’ve been mainly training outdoors recently, and I can make power graphs look like that too.
In the past I posted similar pics on indoor workouts.
The conclusion I came too - both inside and outside - I can create more/less power variability by changing pedaling:
not paying attention to pedaling and sloppily pushing over the top
paying some attention to pedaling and not being sloppy
actively focusing on a smooth and controlled pedal stroke
actively modulating power during on/off transitions
big vs little chainring, with little chainring for me being unnaturally smooth, something that can’t be observed outside even in the best of conditions
And the same can be said of outside under good conditions (flat road, consistent wind speed/direction).
It is simply easier to see “variable/erratic vs smooth” inside on the trainer, and then start focusing on how to make it smoother and less erratic.
I’d bet that if you pay attention to your pedal stroke, you can control the power variations. For example more power spikes/variability if you “pedal sloppy” and throw the pedal over the top and immediately let off the pressure. And less variability if you “pedal smoothly.” Doing those two pedaling scenarios I can change the power graph both inside and outside.
It just a hunch, taking a break after “warming up” led to the smoothest pedaling of the workout. And then your pedaling deteriorated and the power starts looking noisy / erratic / variable.
Just a hunch. Putting my betting hat on, I think it’s less likely about your trainer/radios, and more likely your pedaling. Likely something only noticeable inside on the trainer.
If these scenarios, would your cadence number still be pretty consistent even if pedaling wasn’t as smooth as it could be? I’ve been trying to keep a consistent cadence around 90 RPM (and that seems to be working based on the graphs) but I’m sure there are times when it’s more/less smooth.
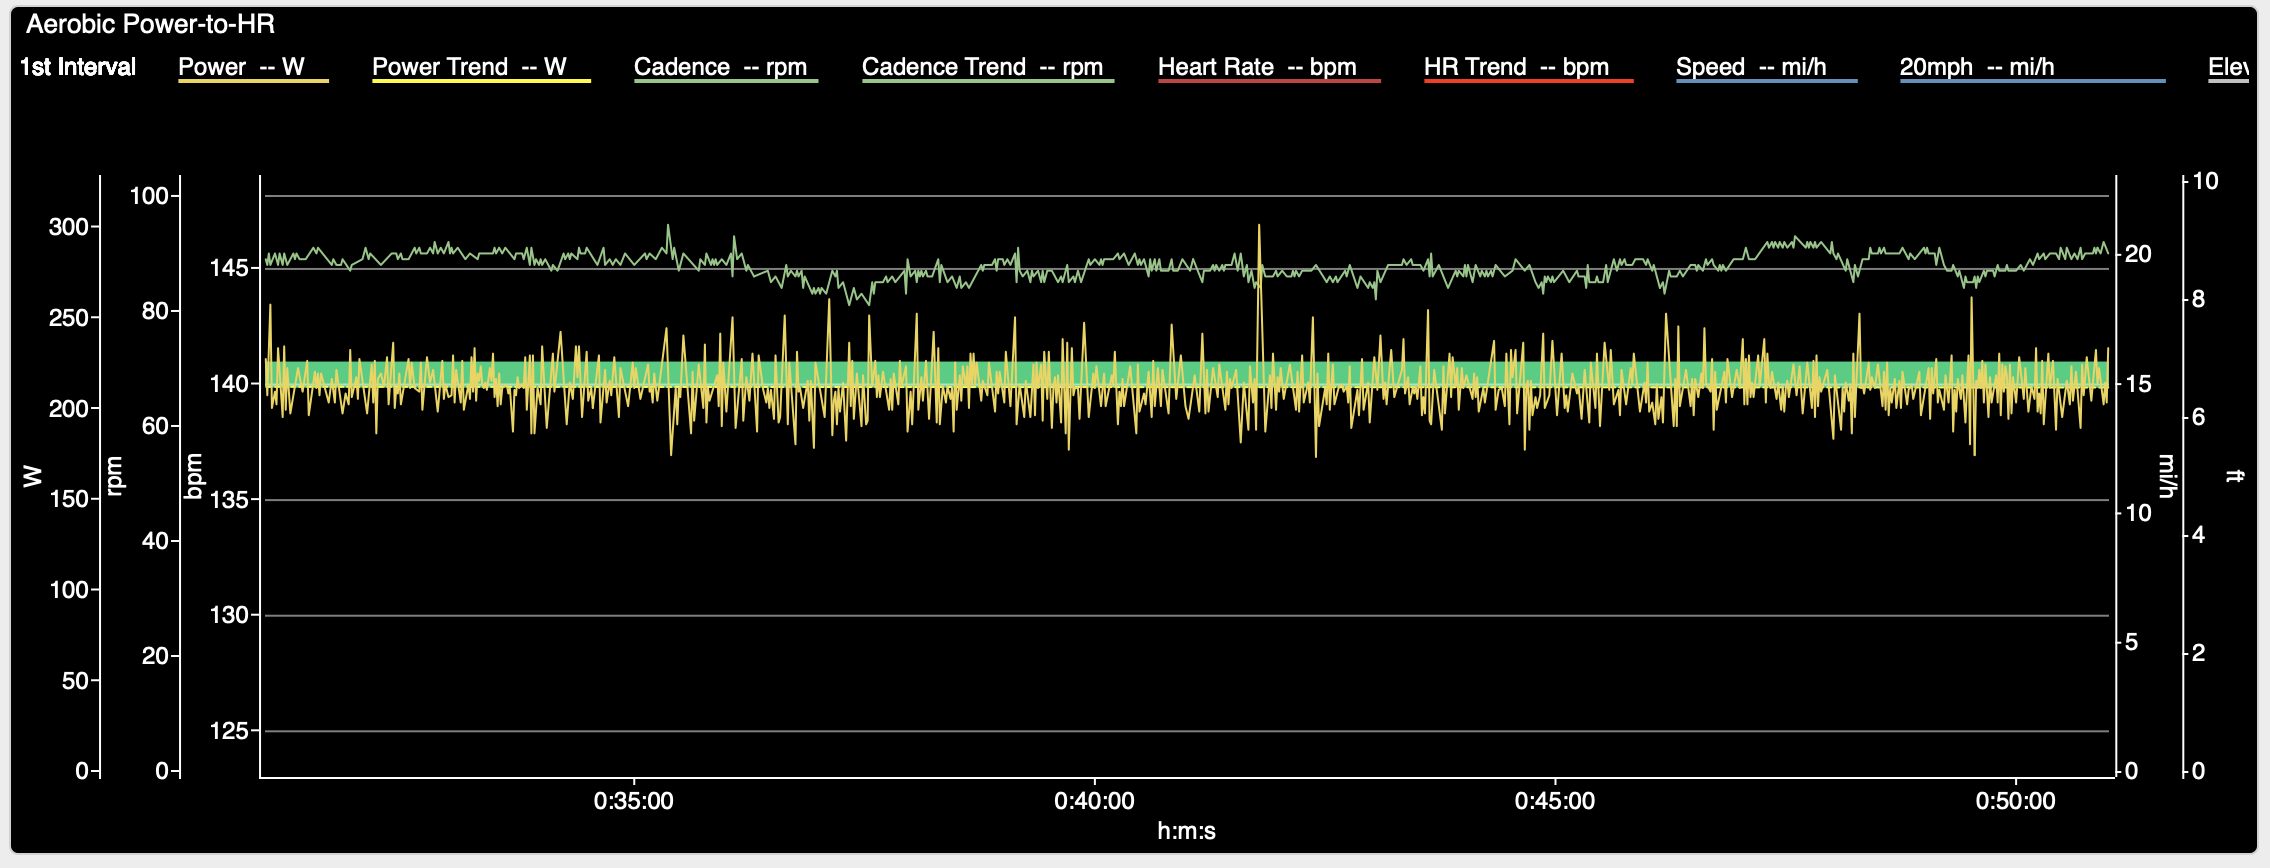
Using basic statistics, the power’s standard deviation is 16W around an average/normalized power of 227W (247W ftp, about 92% of ftp). In my experience with PowerMatch, 16W standard deviation is on the higher side of normal when using Erg. But its still normal. And for many, much lower than what you would see outside.
In other words, even though cadence is varying, if you (unnaturally) examine inside power under a microscope, its almost always smoother than outside and almost certainly (in the case above) will NOT impact the adaptations of a sweet spot workout.
I appreciate the insight here and you’re definitely more adept at digging into the data than I am.
The image here is a snapshot of 5 mins roughly in the middle of the second interval. Cadence averaged 89 RPM and looks pretty consistent on the graph. Per TP for this interval, min was 85 RPM and max 95 RPM. I still have super low spots, like the 18W point noted here. TP showed a minimum power of 9W.
I know I’m not a machine, but I wouldn’t think there would be so many low spots given a reasonably consistent cadence in ERG mode. I’m still getting the work done, just trying to make sure everything’s working as it should. I’ll try a fresh battery and ANT+ just to see if there’s any difference just to satisfy my curiosity!