They don’t provide nice fatox/lactate curves. However, there are some points which add to the studies by ISM/Brooks and Gonzalez-Haro. Furthermore it gives more context to what DrMF is saying/claiming in his lipid power article.
Firstly, the most important aspect: study subjects:
Moderately trained, about half men and women, slightly on the heavy side.
Then, they don’t report averages and std but describe the population with median, quartiles and max/min. This is interesting as it shows the variability better. And the data varies quite a lot.
Fatox_max occurs at first La rise above baseline (this is really consistent with all the other studies)
fatox_max → 1.4 mmol/L (q1=0.9, q3=1.8)
at 2mmol fatox is still at ~86% (variation, variation)
they only report heart rate at this Individual Anaerobic Threshold (which may correspond to baseline + 1.5 mmol. Hence, this would be close to DrMF’s upper Medio at 3mmol), no fatox or RQ. Ballpark guessing from the reported medians, assuming a linear increase in heart rate, one could assume 50-70% of fatox_max at this point. However, this is just really a rough guess. Especially in this study population where we can assume steeper slope of the declining fatox curve past the elevated fatox range.
Overall, this does not really contradict what we see in the other studies.
Thanks for sharing this @sryke. Interesting. So does this mean it is fairly consistent with the likes of San Millan’s philosophy of training between 1.3mmol and 1.8mmol - with 1.8mmol being where San Millan defines LT1?
I think from memory San Millan in one of his papers references the highest FatOx range as 0.92 +/- 0.27mmol (close to the 1.3mmol lower end range of his recommendations). This was, however, for a different population group - elite cyclers. I would call it pretty close to the 1.4mmol in this instance, though.
The 86% FatOx at 2.0mmol is interesting. Still high, and close to the ‘common’ LT1 marker in many studies that I have read - Sieler has this has cut off point of Zone 1 in his model. At the very least, the 2.0mmol point provides a uniform base point to analyse future readings from.
From what I can gather, cycling around that 1.2/1.3mmol mark is roughly where the greatest FatOx rates seem to be.
The question I have is, are there any physiological training benefits to cycling closer to the 1.8-2.0mmol mark over the 1.2-1.3mmol mark? Picking hairs here - marginal gain talk most likely - but keen to understand it a bit more.
I know Doc MF recommends cycling in the 2-3.5mmol range - Medio I think he calls it - which I assume would be around mid Zone 3 - Sweet Spot in the Coggan model?
The old days, this was still written with a typewriter.
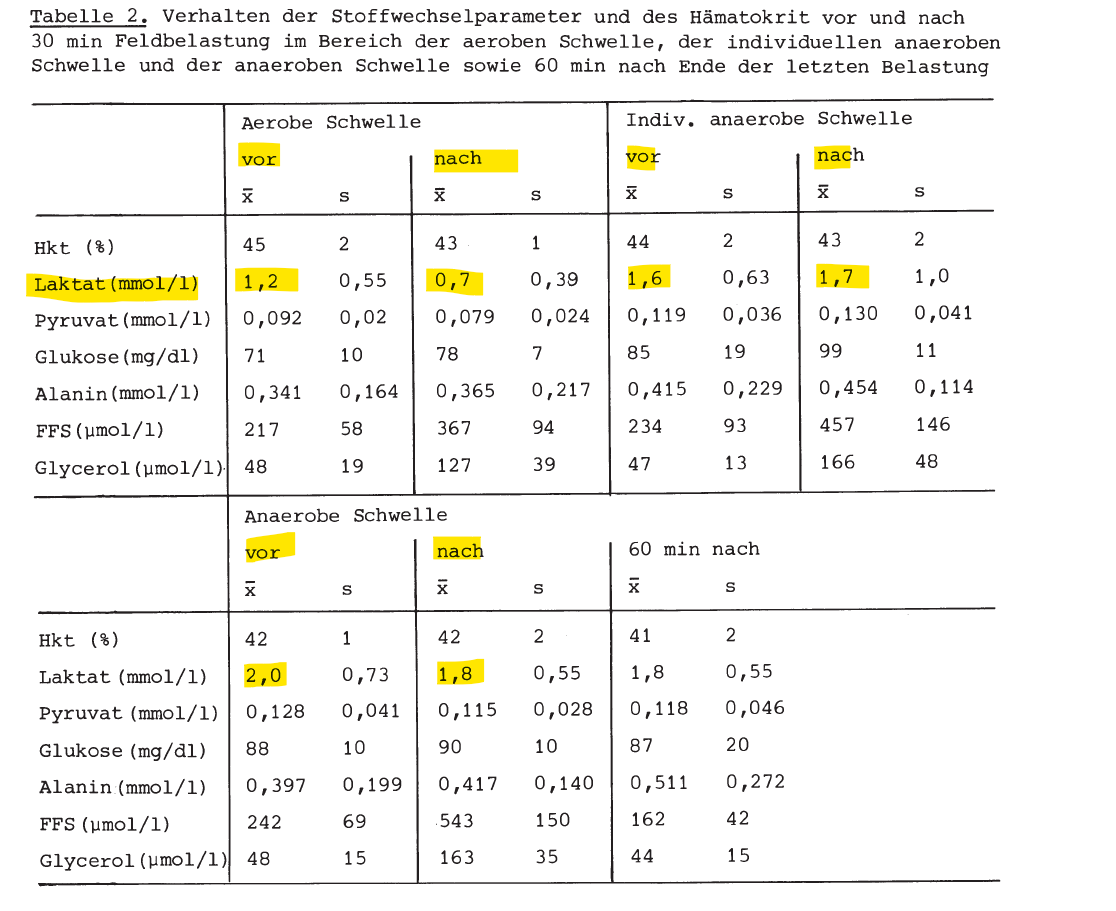
Actually an interesting experimental set up:
determine speeds at 2mmol, IAT, and 4mmol in the lab
have them walk (elite race walkers) at these speeds outdoors (I don’t know if this is a valid assumption, e.g. translate indoor to outdoor speeds)
fat and carb ox is estimated via blood analysis (fatox: plasma Fatty acid / glycerol is supposed to be a marker for fatox. I don’t know if this is still a valid assumption)
they walked for 30min at the respective speeds. Seperated by 60min rest
They took blood samples before and after each work bout
values before and after the first bout are plausible. However, why are La values already elevated before the second and third bout? At that fitness level 60min should be really sufficient to bring La down again.
One potential explanation (they don’t address this in the paper) may be food intake. They had subjects ingest a carb/protein mix right after the first and second bout. This may have raised La levels. One recommendation for La tests is to do them fasted or not to eat for at least 2h before. This food ingestion could have caused the La readings. So for all the DIY-testers here this may be important.
I noticed an increase in variation when not warming up properly. Dottore even recommends 1hr. I must say the older I get the more warm up is required, it takes some time for the engine to fire up.
The discussion is not really revealing. And the paper hasn’t been cited that much. The author has published other papers with ISM.
I’ve always been wary of these fatox/carbox spiroergometries. So many factors influencing the outcome. Especially, we always just test people when fresh. But what about after riding for 1h or so. How does a graded test turn out then.
There a few studies showing that one of the key adpations to endurance training is the higher fat utilisation at higher intensities. Even at HIT. This is not always caputered in these graded tests. HOwever, I don’t know what I’m missing here but it is odd that the same study protocol produces such a different outcome. And it does not get picked up by later research?
However, that doesn’t mean that you need to, or even benefit from, training at a high rate of fat oxidation. That’s just as fallacious as thinking that maximizing time at/near VO2max is important.
Thank you for bringing this up as a consideration! Good by you. Will do my lactate tests first up in the morning when the machine rocks up.
Keen to hear more about this @old_but_not_dead_yet. What are your views on increasing fat utilization and how to do that as part of a program? As I mentioned in my post above, from what I can gather, cycling around that 1.2/1.3mmol mark is roughly where the greatest FatOx rates seem to be.
The question I have is, are there any physiological training benefits to cycling closer to the 1.8-2.0mmol (LT1 threshold) mark over the 1.2-1.3mmol (lower end of ISM recommendation but where the highest FatOx rate seems to be) mark? Picking hairs here - marginal gain talk most likely - but keen to understand it a bit more.
Also, I know Doc MF recommends cycling in the 2-3.5mmol range - Medio I think he calls it - which I assume would be around mid Zone 3 - Sweet Spot in the Coggan model?
Just one of the many misconceptions that seem to be prevalent in this forum. The purpose of endurance training isn’t to increase fat oxidation, it is to decrease carbohydrate utilization. The way to do that is to make your muscles more like your heart, i.e., packed with mitochondria. Lots of ways to achieve that, but training at “Fatmax” isn’t the key. For that matter, neither is training at a specific lactate concentration.
I was always under the impression that Couzens doesn’t really understand ex fizz. This right here proves it.
“The ventilatory rise is explainable as previously mentioned on the basis of blood HCO3 buffering mechanisms, in which the additional CO2 produced with the recruitment of FOG (type IIa) fibers via their preference for aerobic glycolysis (sugar burning) over lipolysis (fat burning) results in temporary buffering with NaHCO3 to form Carbonic acid, which eventually is expelled (as CO2 gas) via increased ventilation when it reaches the lungs.”
@CH01
I think you are interpreting the study incorrectly. He’s not giving a general range that is applicable to all cyclists.
Let’s say you grab 10 recreationally fit cyclists. You give them an FTP test. They “score” anywhere between 220-300W. On average they score around 260W. You take another group of cyclists (world tour pros), you give them the same FTP test. They “score” anywhere between 370-430W. On average, around 400W. Remember those averages.
You get invited to several podcasts. The host asks you: “CH01, tell us, what is this FTP of which you speak? Is it the secret sauce?! What’s the range or zone?” You say, well it is anywhere between 260W - 400W (the respective averages for the two groups). The 260W comes from the one group, the 400W comes from the other.
Would your conclusion as a listener be to train somewhere between 260W and 400W? As in: this guy is telling me my zone is 260W-400W.
No, your conclusion would be “oh, there is a discrete number, not a range…and my number applies to me”. If I choose to, I could then go measure my own FTP and realize I’m 295W (within the range of the recreationally fit cyclists in your study). Or maybe I measure it and “score” 365W (holy crap, get that boy a contract).
What you don’t think is: this guy with his study on the podcast is telling me my FTP range is 260W - 400W, and that is how hard I should ride my bike. ISM is not conveying an individual training range. He’s not saying you CHO1 have a range of 1.3mmol-1.8mmol. He is conveying respective averages of the two groups, the same way you would say “well, it’s anywhere between 260W and 400W”
^^^^ implication that he doesn’t state: yes, and you have to see what yours is yourself. ^^^^^
What might be confusing things is that DrMF is giving his forum readers zones/ranges. He is anchoring those zones based on two discrete values (analogous to how you might base training off of one value: FTP). His values are AT2 and AT4. That means, 2mmol and 4mmol, respectively. (in the old days and now less common: one definition AeT was 2mmol for everybody, and 4mmol for AnT for everybody). If you read Alan Couzens article @sryke posted, he uses inflection points on the curve…much more common (and likely more valid).
Point is: DrMF is providing zones because he is anchoring on a predefined fixed value. ISM is not. You find your own LT1 and create your own zone based on that anchor.
As @sryke and I were discussing higher up in the thread, it’s not important that DrMF uses these (perhaps) outdated definitions of AeT and AnT. It’s the trend and the relationship between them that we’re interested in.
Thanks for explaining @tshortt. Excellent explanation. Much appreciated. You’re right, I am getting confused between a fixed range model and a mean range model based on different population groups. It gets very confusing when you try to amalgamate the two to make sense of various models! You end up getting things wrong and misinterpret what is being said. Throw Coggan zones and Seiler zones into the mix and, wowee, you got yourself one heck of a cocktail of confusion.
I get it now. I think. DrMF is providing fixed values, the 2mmol and 4mmmol values, whereas ISM is moreso providing mean values based on two separate target groups. Would I be right in saying that if you were to follow ISM’s model, you would have to find your own LT1 and then train just below that? Whereas with DrMF he just says to mainly target the Medio range of between 2-3mmol.
What is your source for the older screenshots (2013 and 2014)? I have found the newer posts (2016 and onwards) on his website, but it looks like some of these screenshots are from an older forum and would make for some interesting reading.