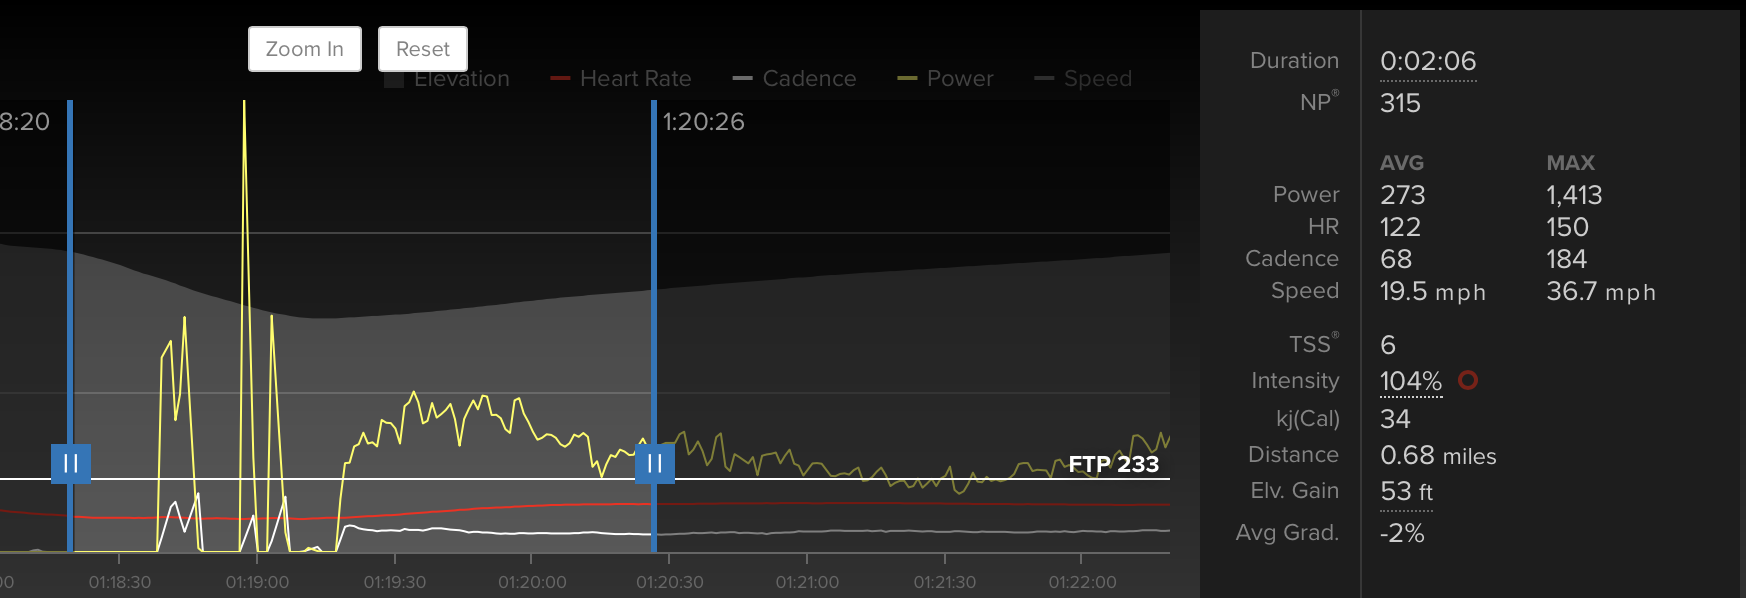
On the outdoor rides you are hitting max power numbers that seem unreasonable. The second outdoor ride shows max power of >1400 watts. Those spikes are a problem with the power meter. You could load the file into Golden Cheetah and remove the spikes over 600 w (my ball park estimate for your max power) and see what your NP comes down to.
Another way to get at the reasonableness of your outdoor ride numbers would be to get a power file from someone else from the group on those rides and compare it to yours.
Depending on the power meter (i.e. if its a crank arm model), these types of power spikes are very common when encountering rough road (or if you are on an MTB)
Fair point. That makes sense. Those do look like outliers. I can’t fathom a 110 kg rider having a max wattage of 600 though but you’ve taken the time to actually look at some of the ride files so you’d certainly have a better idea.
Sorry, I missed the 110 kg part. It makes the average power numbers look unreasonably low at that weight.
The relative numbers should be similar to someone doing the same ride. The TSS, the NP relative to the average power. Their should be lots of comparatives for the ride if someone else has some data.
I’ve had power files results skewed with one data spike and their appear to be a number of spikes in these files.
You guys obviously have A LOT more experience than I do…thanks for the valued input. It makes sense as I read it.
I use a Stages Left Side only arm, and our (South African) roads do have some rough bits so its possible that those spike may be as I transfer power and knock a rough patch in the road?
Lots of comments I agree with:
My testing protocol needs improvement. Will also run the ramp test via a windows (GRRRRR) machine and see if it makes a difference. Also need to work harder at my effort. Outdoor and in spin class I manage 170-180 bpm.
I will try and get power comparison with someone we ride with…but you all know the “secrecy” of power figures in a semi-competitive group.
I have only had the PM for a little over two weeks and need to do more repeat rides to compare data between.
Again, thank you for everyone’s input and time taken. I appreciate it.