Outside my cadence is variable to deal with changes in terrain.
Inside in erg I would expect cadence to be more consistent but it doesn’t have to be.
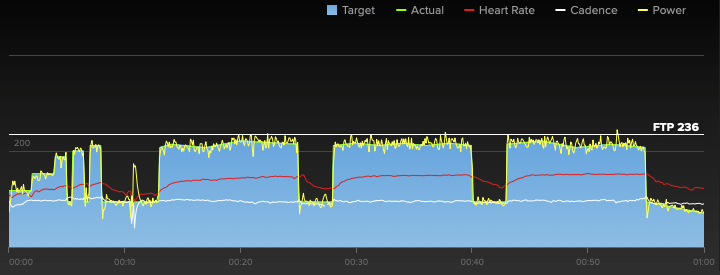
Here is Kickr power on Geiger SS workout from May 2018:
and with PowerMatch (single sided Stages PM) a couple months earlier on Hunter:

Pay attention to the 2nd twenty minute interval, from 1:02:00 to 1:22:00.
Notes from the original thread PowerMatch Experiences - #84 by bbarrera plus a few more observations:
- most of my TR PowerMatch graphs are “cleaner” than that
- looks like my pedaling was a bit choppy that day except for that first 200+ watt section during warmup
- on the 2nd SS interval you can clearly see near the end my cadence increased and power dropped below target
Zooming into 2nd interval using WKO to graph:

and cadence distribution:

and zooming in a little closer, and adding Sweet Spot color zone (88% to 94%):

power is ‘close enough’ to sweet spot zone while cadence (green line above) is varying a good bit:

Using basic statistics, the power’s standard deviation is 16W around an average/normalized power of 227W (247W ftp, about 92% of ftp). In my experience with PowerMatch, 16W standard deviation is on the higher side of normal when using Erg. But its still normal. And for many, much lower than what you would see outside.
In other words, even though cadence is varying, if you (unnaturally) examine inside power under a microscope, its almost always smoother than outside and almost certainly (in the case above) will NOT impact the adaptations of a sweet spot workout.
Does that make sense?