Runalyze.com can do the same LT1 estimation if your watches, head unit can record RR intervals (typically all Fenix series, FR9x5, etc.)
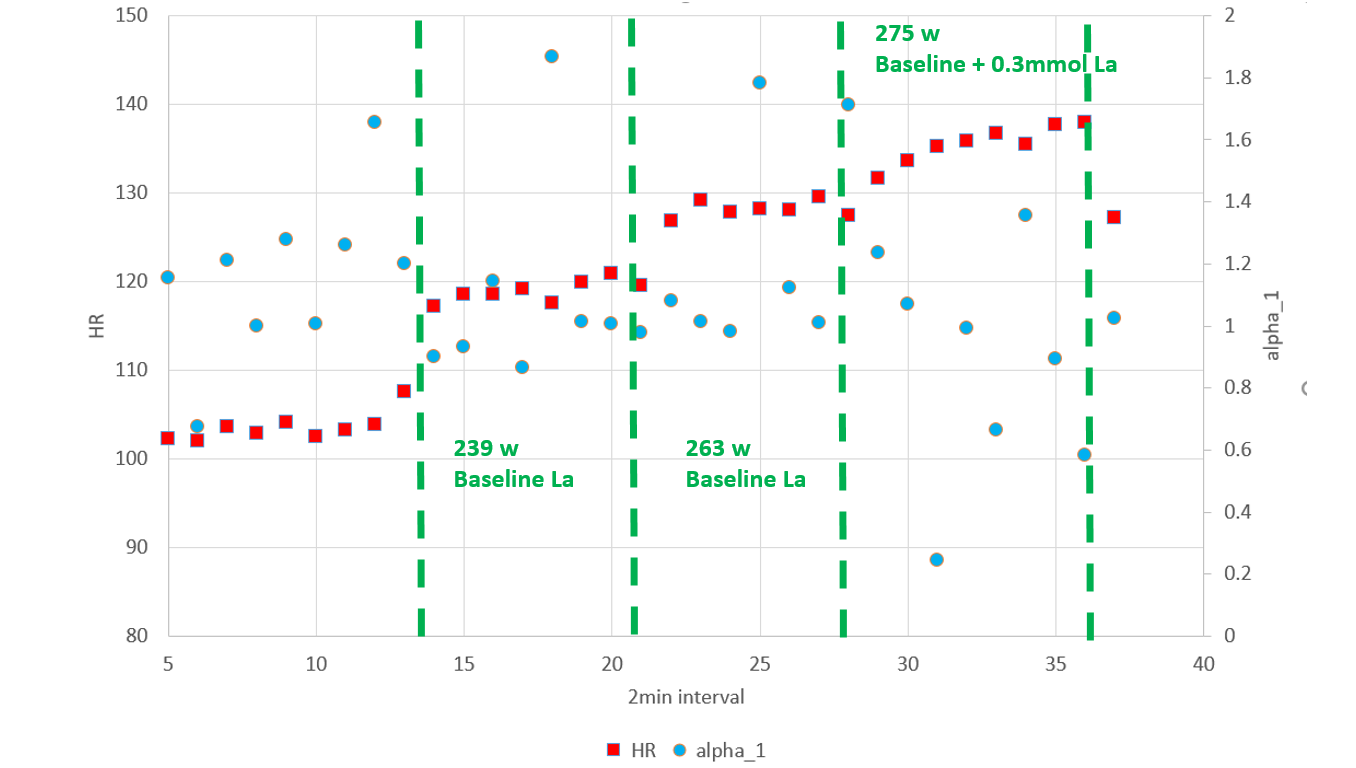
So more on this, first of all the entire ride:

Distinct cardiac drift. I measured La along, the final 16min at 253W are interesting. Lactate corresponded to the heart rate (e.g. 141bpm, ~0.4 mmol above baseline), whereas the power is clearly below LT1 (when fresh). I’ve highlighted a 15min interval after an hour, baseline Lactate: 270W.
Take home message: heart rate seems to correlate well with La, power changes throughout a ride. However, I’ve eaten a few bananas during the ride. Impact?
Now onto DFA a1, plot HR vs a1 for the enire ride (well, not the entire ride as I only recorded the first 1:20h and the highlighed 30min and 16min intervals.
Entire ride:
LT1 ~ 138bpm

Cherry picking the cluster > 125bpm

What HR threshold estimate does the Python script spits out for you?
Never got to this point when playing with the notebook, data was always too messy.
I would just use historical rides and trust the 5% threshold for artifact removal and see where it lands for you. One thing I did notice is that it’s that you get a more accurate reading if you go above in terms of intensity…As recommended by Bruce Rogers.
Have you got a record of how many artefacts you got for the different points because that apparently can cause errors in the DFA value.
I had a large number of artifacts with my tickr, which made the numbers useless.
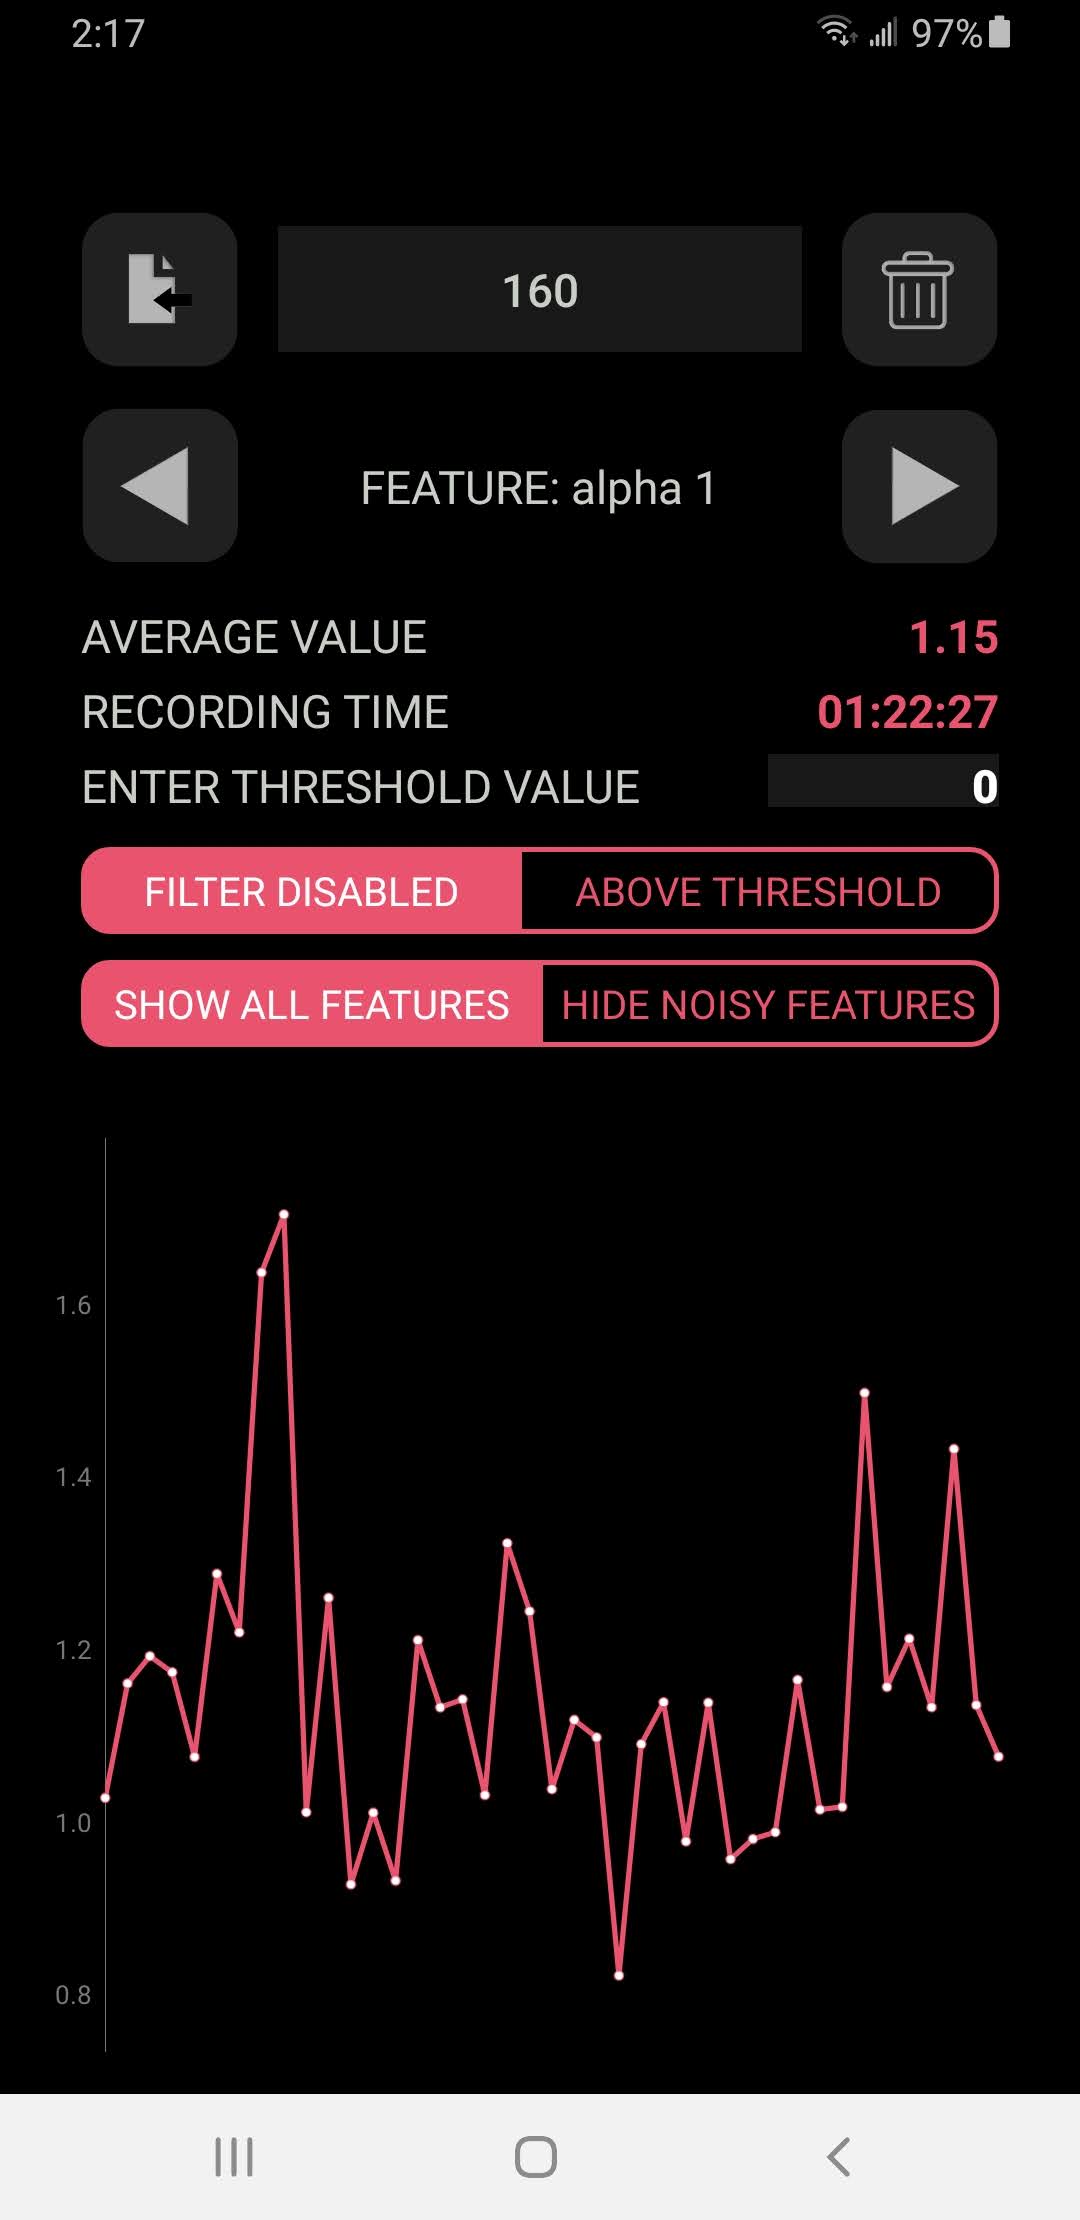
I moved to a Polar H10, and the artifacts went away and only happen occasionally. The numbers are in a more reasonable range now, but they are so variable that I find it hard to do anything with them. Here is from a session at 160 watts, in ERG mode. The spike early on I stepped of the bike, the rest of the session was steady at 160 watts. (4 artifacts total in the whole workout.)
This type of variability is typical for me. If I were to do a step test, I’d need steps of 30-60 minutes I think. Alpha 1 decreases with intensity for me, but with this much noise/variability in the data it doesn’t really help me find my aerobic threshold with much precision.
A couple of points.
-
It decreases with intensity for everybody, meaning the series go form uncorrelated to anti correlated.
-
It seems that you were going too easy in this effort.
-
For a protocol, forget about watts, try to get your HR between 80% to 90% of LTHR in steady steps…and for the final step, go beyond, like 92%-95%.
-
I don’t use HRV logger up, only the Python script on historical data. I get very consistent estimation of my AeT HR. For me, nothing revelatory, but a nice confirmation of RPE.

I have done harder efforts, but I still see the highly variable data, where I’ll get data points varying between (for example) 0.80 and 1.00 or so - a very wide range when I’m doing a consistent effort for 30-60 minutes. I’ll try to give the python script a go, as ‘eyeballing’ the data doesn’t give me confidence in it producing a consistent/accurate number.
Wow, I feel like I just took a wrong turn and entered a lab  Science sure has progressed a lot since I last used an HRV measuring. Or maybe we make science of everything now?
To get back to the original question, I have been using Elite HRV myself 4 years back, but quit after I no longer could trust the data.
My two cents on the methodology:
- Too new science if you ask me and requires more refined hardware and software, as well as proper research, though I may be out of date. 4 years ago, I had little use of my measurements each morning over many months and quit because it did not add anything to my training schedule but unnecessary routine and doubts. At least, not more than how I felt in my body.
- What it clearly indicated was illness, days ahead. Poor HRV showed a flu maybe two days ahead, for that it is perfect, but usually you feel illness immediately at training start.
- There is a simple method to TEST the consistency of the readings (for EliteHRV at least): repeat the test 3 times in a row right after each other. It takes a few minutes only, it should not make much of a difference. My findings: shocking differences while still lying still, fluctuations without pattern. This made me decide in the end that it did not work properly. You cannot have a value of 8 and 4 in only minutes, clearly wrong data.
- Avoid falling into the trap of wishful thinking, by reversed logic: we start explaining figures when we see them, even if we do not agree with them. From then on the data does not help us. Better to estimate it yourself and write it down first each day, then verify what the measurement gives. That is a much better learning.
My advice overall: listen to your body. I am a tech geek myself since childhood, but HRV gadgets are just not proven science for me, yet. I did not have much gain from what the app told me and I never adjusted training, only when I fell ill. Usually a fit person can already see during the first 10 minutes into a training how it will go and adjust accordingly. Definitely on a trainer.
Interesting read of your experience. I have been using it a year. It hasnt told me anything I didnt already realize.
On the subject generally, assuming you’ve had a really bad reading (not the daily readiness nonsense, but an unusually low HRV figure compared to normal), and you’re feeling it too… how exactly would you tweak your workout?
I have a particularly tough session planned in, and I know I should change it, but I’m not sure what’s best. More rest intervals, lower intensity, lower TSS?
Delay it a day and do a recovery or endurance ride instead.
I might give this a go. The only time I’ve done something similar in the morning is before, say a long group ride that day that I’m more or less committed to. If my first reading happens to give a low reading which just puts it into the “take it easy” range I’ll take it a again a few times until it doesn’t!! Then I’m good to go
Yeah with Whoop if I change the sleep I get a different score.
One day I altered it and went from 40% to 1% !!!
I tend to ignore the score, the HRV number on its own shouldn’t really change much at all (assuming you’ve done a long enough test / have a decent sensor).
For DFA alpha 1 based LT1 estimation, where do y’all find your LT1 falls as a percentage of FTP? I did a quick test last night and while there was a little variation, the trendline puts my LT1 at about 74% of FTP, basically right on the Coggan Z2/3 transition point (which I believe is often regarded as the approximate Seiler Z1/2 boundary or LT1). Does that sound right? For some reason I was thinking it would be lower but I guess that actually makes sense.
Is there any info out there on how close you need to be to that LT1 for the most effective sub-LT1 training?
Since I started looking at the DFA alpha 1, it seems to put me between about 75-80% of FTP. This was also a fair bit higher than I had estimated using other methods (breathing/talking tests, etc.) - I would have put it more right around 70% or so based on those. After doing more work at these higher percentages of FTP I’ve come to the conclusion that I was likely being too conservative in my estimates based on breathing, etc. My big issue with DFAa1 is that it is highly variable for me even when doing a steady state effort - I often see it vary +/- .2 while doing a stead state effort, so it’s really hard for me to see this as something all that precise.
I have not seen any literature regarding how close to LT1 is best, but the advice I have gotten is that it is better to be a bit too low than too high. I take this to mean that it would be better to be 5% below LT1 than 2% higher - as I understand it the desire is to definitely be below LT1.
I seem to have more cardiac drift when I ride ‘closer, but below’ 0.75 DFAa1, so this either means that this measurement is off for me (or I’m doing it wrong), or riding just under your LT1 fatigues me enough that my power at LT1 drops. Either seems to be a reasonable explanation of what I am seeing.
I am looking at HRV as a tool to hopefully provide some insight into the training loads and fatigue from training and life that lead to a triggering of my Tachycardia. i have it pretty well under control at the moment, but as I start to revert to my old ways and pushing the limits, I feel it might rear it’s ugly head again soon.
For those experienced with using an app like HRV4, Elite RV or Garmin Connect to measure HRV, I’d appreciate your input on how best to utilise the equipment I have already got, and what i could buy additionally, to get an effective and accurate measurement regime going without spending a fortune.
I have the following
- Garmin 530 which can record Stress levels using a HRM strap
- Samsung S10E which does not have a PPG sensor like other Samsung Galaxy phones
- A Garmin HR strap with a Wahoo TICKR on it (long story but it works fine for measuring HR).
One option is to use one of the phone Apps with the HRM strap, but putting a HRM on first thing in the morning when i wake seems a fiddly way to do it and unlikely to be sustained.
Another is to try and use the S10E camera with the HRV4 app, if that works given the phone doesn’t have a PPG sensor. I can’t test this without buying the app, so I have dropped them a line to see if it would work.
I have considered buying an affordable small form factor wearable (if there is such a thing from say Fitbit or Garmin), but know very little about these nor whether they do a good job or not. If it did, it would seem a tidy way of capturing the data.
Are there other options that make sense to consider from your experience?