This seems variable enough. Average does a terrible job at describing the session.

1 Like
Sure I do this.
I hear what you’re saying but I still think it would be useful to have a sense of variability. We keep using the term “normalized”, and whereas I think that is overkill, I think the spirit of the OP question is give me a sense of how variable this ride was compared to other rides. (in terms of HR). You get that via power measurement, but that’s load, not strain.
Power measurement is fundamentally different than HR (not the least of which is the scale), so our use of the term “normalized” is what is bugging me the most. We don’t need normalized HR necessarily, simply because there are simpler ways of addressing the overall need/want.
So I guess I just disagree that it’s not “variable enough”.
I could imagine learning a lot. Avg. bpm is 141. Suppose normalized bpm is 150 (or even 145). Given what others have said - that the variability index will be close to 1 - small fluctuations are meaningful. That is, maybe as we used avg. vs normalized heart rate, we would learn that a 10 bpm difference for a ride means it was a wildly variable ride.
Now, suppose you are a TTer without a power meter. Could meaningful insights not be learned? One could argue to look at heart rate time in zone, but that might not represent what I did in a meaningful way. One hard effort that raises heart rate is different than going too hard up every hill on a course with rolling hills.
Scales are arbitrary. All this means is that small differences in avg. vs. normalized heart rate would have a different interpretation than small changes in avg. vs. normalized power.
This is simply false. I just created a descriptive metric that captured the variability in HR. Do I know if it relates to any physiological stress? No. But I know that it is possible to create such a metric which could then be validated through research. Happy to share some figures if interested.
1 Like
How do you want to normalise it?
You could certainly do some interesting things. You could normalise the heart rate into a scale 1-10. Then use that to give the session an overall RPE as well as graph the RPE second by second.
After that thread linked above, I’ve vaguely looked at HR standard deviation.
Here are a handful of examples, look in the lower left for HRavg and Standard Deviation:
- 10-min Tempo, 10-min Tempo with 15-sec accelerations, 20-min TT, and 124 minutes total:

- 60+ min at sweet spot (.90 IF) and 97 minutes total:

- 100-min easy endurance (.69 IF), zero decoupling because power was increasing, and 123 min total

- 2 sets of 8x30-sec(180sec recovery), with 7+ minutes above 400W, and 122 minutes total
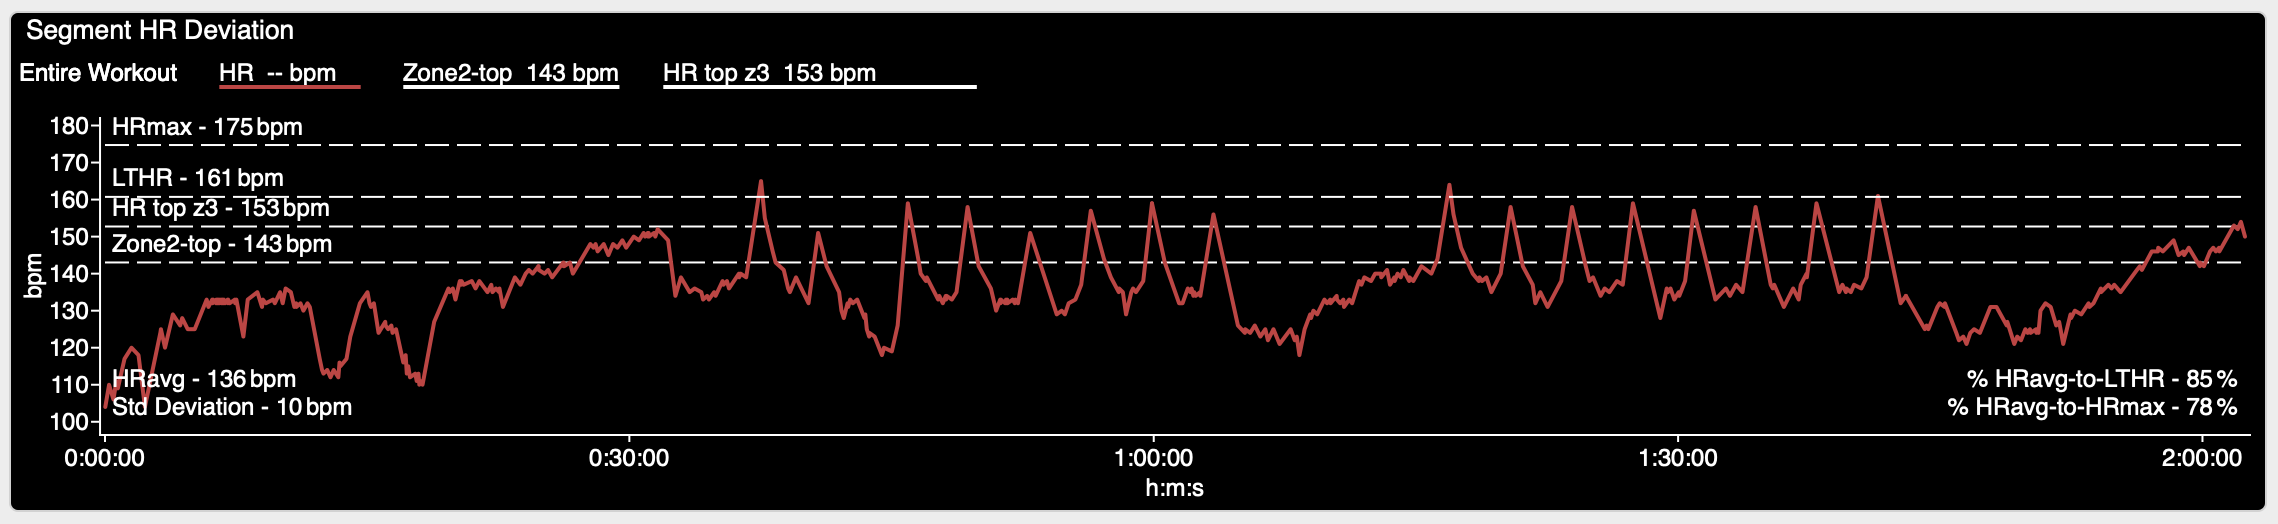
These 30-sec repeats focused on my anaerobic capacity and required days and days of recovery (my coach said a nice goal for the next time would be 10x600W ![]()
![]() ).
).
But compare 4 to the others if we define internal strain as Std Deviation and HRavg… using those two measures the Anaerobic Capacity workout is more similar to the 2 hour Easy Endurance than the others! ![]()
So don’t do that. In fact, don’t use HR anything for an Anaerobic Capacity session.h
Find a hard 80 mile gravel ride with 11 hills that you either raced or went hard. Also, rest stops, mechanicals, train crossing.
Now find the solo training ride of roughly the similar duration. Only one nature stop. Same answer? If so, I’ll concede, but find a few examples where HR is actually informative.
Also, I’m not saying it would be a measure of strain. It would be a measure of the variability of strain (e.g. VI is not a measure of load)
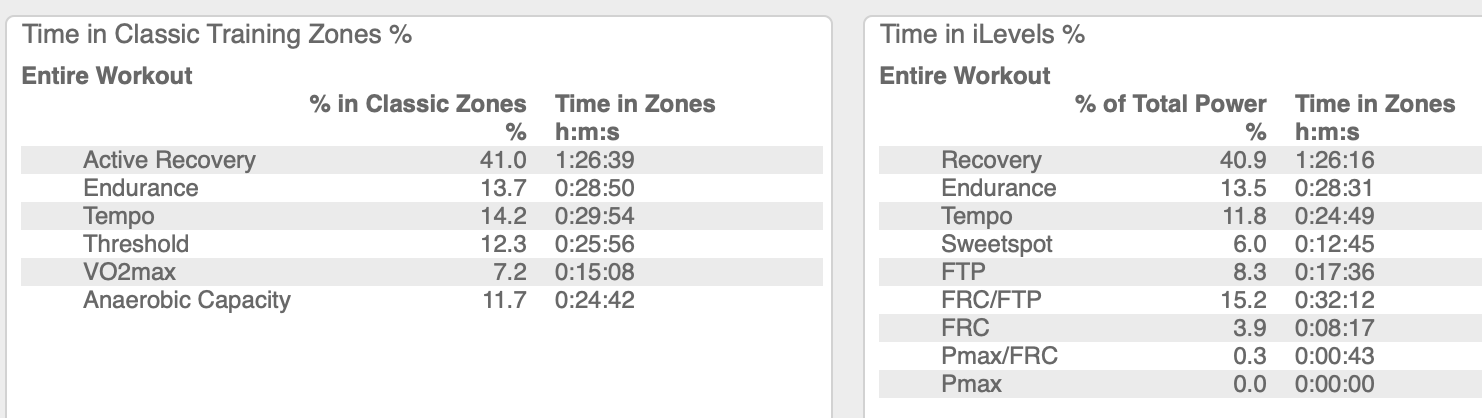
I’m going to pull out some stuff from Intervals and compare. Intervals has a “HR Load” which is hrSS (normalized TRIMP), a form of TSS but uses HR rather than power.
I believe one of the primary reasons for TRIMP / HR TSS, and Power TSS, is to support charting out “dose and response” and taking into account the fact that activities with more higher intensity work should be given more load credit, at least in the context of dose and response.
Using the 4 workouts above, plus this week’s 90-min Wed group ride
| Workout | Duration | TRIMP | HR Load / HRSS | Power Load / TSS | Work>FTP | W’bal Delta |
|---|---|---|---|---|---|---|
| 2 x tempo + 20min TT | 120-min | 205 | 119 | 135 | 39kJ | 21.3kJ |
| 1 hour at 90% ftp | 97-min | 180 | 102 | 119 | 12kJ | 5.8kJ |
| Easy endurance | 122-min | 163 | 90 | 98 | 14kJ | 6.1kJ |
| Anaerobic capacity 2x 8x30-sec(180-sec) | 116-min | 175 | 102 | 161 | 126kJ | 10.7kJ |
| Wed night ride | 97-min | 104 | 78 | 86 | 42kJ | 8.9kJ |
Edit: posted TRIMP the first time, adding a column for HRSS.
Going to be honest, the TRIMP score does nothing for me. Not much difference between easy endurance (163 HRSS) and anaerobic capacity (175 HRSS). Hmm. The HRSS more closely aligns with TSS, except with the anaerobic capacity.
Provided I copy&pasted that Intervals data correctly, it seems power based TSS does a better job at ranking my perception of recovery required. I believe one of the primary reasons for TRIMP and TSS is to chart out “dose and response”
Re: the unstructured Wed night ride… There was some wind and I mostly rode 3rd or 4th wheel behind two bigger guys.
Garmin rated the Wed night ride as “Impacting Tempo: this activity had enough effort at tempo pace (medium to high intensity) to improve your muscular endurance.” and benefit of “This activity enhanced your ability to maintain a moderate pace for a longer amount of time. It increased your high aerobic training load.”
Here is the 30-sec power with tempo zone in yellow:

where it clearly looks like riding at tempo for long stretches of road. Zooming into 31-minutes where it wiggles around the yellow, its 0.85 IF with 1.05 Variability Index.
In this particular case, I think Garmin nailed the analysis of that unstructured ride.
And FWIW here is the power and HR zones for that portion of the ride:

1 Like
I’ve got 2 rides in mind, 3.75 hour solo ride with IF 0.87 and about 37-min of stops (2). And 6 months later a 3.5 hour group ride with 0.91 IF and about 15-min of stops (2). Both around 290 TSS. Both around the same ftp (260). Similar average temperatures in the upper 60s.
How are you suggesting I compare them? It needs to be something I can pull out of WKO or Intervals or GoldenCheetah. I’m interested in seeing if there is something HR related
power or HR or both?
- SOLO ride
- elapsed = 4:31:00 (4.5 hours)
- moving = 3:46:31 (3.75 hours)
- course: completely flat
- IF = 0.87
- VI = 1.14

- GROUP ride
- elapsed = 3:31:15 (3.5 hours)
- moving = 3:14:43 (3.25 hours)
- course: rolling and 1 steep climb
- IF = 0.91
- VI = 1.38

Comparing HR time-in-zone
Solo:

Group:

Comparing HR distribution
Solo:

Group:

Comparing Power Time-in-Zones
Solo:

Group:
1 Like
They both felt hard, but in different ways. My two examples there is very little time at or above threshold HR. Neither are races as with your example. The question I responded to was about longer events. The solo ride had more time at higher HR zones, while the group ride had more time at higher power zones. But over 3 hours, either the power or HR stress scores are somewhat the same.
Going back to the original poster’s question…
I don’t think of 1.2 VI as very steady, but ok.
Above threshold times:
- power: 18-min solo vs 9-min cyclocross race
- HR: 0-min solo vs 37-min cyclocross race
I guess your point is that your ~43-min cyclocross race shows higher HR than the power would suggest, when compared to a ~60-min “seems like 11-min time in threshold power zone” workout.
Maybe that suggests racing tends to skew HR high for other reasons?
I dunno but any of this, but remain open minded.