Watts Per Kilogram:How Do YouCompare?
Is your FTP where it should be? See exactly where your power-to-weight (W/kg) and FTP rank among tens of thousands of TrainerRoad cyclists, filtered to your age and gender.
“The last 6 months have brought +25 watts FTP.”App Store Review
Understanding FTP, Watts Per Kilogram, and How You Compare
FTP and watts per kilogram are the two numbers that define cycling fitness. Knowing what they mean, what counts as a good watts per kilogram, and how power zones build on them turns a single metric into a framework for your best training plan yet. Here are direct answers to the questions cyclists ask most.
What is a good watts per kilogram (W/kg) by rider category?
At functional threshold power, a good watts per kilogram by racing category is roughly 3.0 to 3.6 W/kg for Cat 4, 3.5 to 4.1 for Cat 3, 4.0 to 4.7 for Cat 2, and 4.6 to 5.3 for Cat 1, with professionals at 5.2 W/kg and up. Beginner racers sit around 2.4 to 3.1 and untrained riders 1.5 to 2.5. Women's ranges run lower at every level (for example, Cat 3 women about 3.0 to 3.6 W/kg). The table below gives the full breakdown by gender.
| Racing category | Men (W/kg) | Women (W/kg) |
|---|---|---|
| Professional | 5.2 and up | 4.5 and up |
| Cat 1 | 4.6 to 5.3 | 4.1 to 4.6 |
| Cat 2 | 4.0 to 4.7 | 3.5 to 4.2 |
| Cat 3 | 3.5 to 4.1 | 3.0 to 3.6 |
| Cat 4 | 3.0 to 3.6 | 2.5 to 3.1 |
| Beginner | 2.4 to 3.1 | 1.9 to 2.6 |
| Untrained | 1.5 to 2.5 | 1.2 to 2.1 |
What is the average cyclist's FTP and watts per kilogram?
The median (typical) cyclist's numbers shift with age and gender. The table below shows median FTP and watts per kilogram by age group, drawn from a filtered, anonymized sample of TrainerRoad athletes. These are medians only; run the calculator above to see your exact percentile within your own age and gender group.
| Age group | Men: median FTP | Men: median W/kg | Women: median FTP | Women: median W/kg |
|---|---|---|---|---|
| 18 to 29 | 256 W | 3.4 | 182 W | 2.9 |
| 30 to 39 | 252 W | 3.2 | 174 W | 2.8 |
| 40 to 49 | 245 W | 3.1 | 168 W | 2.7 |
| 50 to 59 | 230 W | 2.9 | 156 W | 2.5 |
| 60 and over | 203 W | 2.6 | 138 W | 2.3 |
What is a good FTP?
FTP, or functional threshold power, is a training metric that serves as an anchor point for your training zones. Originally created to serve as a functional training benchmark to control interval intensity and duration, it has been assimilated to many performance proxies over the years, skewing and broadening its definition. It is commonly assimilated with the max power an athlete can sustain for an hour, or an athlete's power at their maximal lactate steady state, or 95% of what an athlete can maintain for 20 minutes, or other test-result definitions. Some of these assigned definitions do not work well for many athletes, so the original definition of a training benchmark to control interval intensity and duration is generally best. As a rough guide, many recreational cyclists have an FTP between 150 to 250 watts, committed amateurs often reach 250 to 350 watts, and elite road racers can exceed 350 to 400 watts. For a fair comparison between riders, power-to-weight ratio matters more than watts alone.
What is a good power-to-weight ratio?
Power-to-weight ratio is your FTP divided by your body weight in kilograms, written as watts per kilogram, or W/kg, and it is the best way to compare cyclists of different sizes. A recreational rider is often around 2 to 3 W/kg. A strong, well-trained amateur typically sits near 3.5 to 4.5 W/kg. Domestic professionals usually exceed 5 W/kg, and the best male World Tour riders can push past 6 W/kg at threshold. Women's benchmarks run lower in absolute terms and carry the same training value. Climbing speed scales almost directly with W/kg, which is why most cyclists track it closely.
How do FTP-based power zones work?
Power zones are training intensities defined as a percentage of your FTP. Once you know your FTP, every workout targets a zone so your effort is repeatable and measurable. A common seven-zone model runs from Active Recovery and Endurance at the low end, through Tempo, Threshold, and VO2 Max, up to Anaerobic Capacity and Neuromuscular power. TrainerRoad uses the same Coggan-based ranges and adds a dedicated Sweet Spot zone (88 to 94 percent of FTP) between Tempo and Threshold, a band that delivers strong aerobic gains for the fatigue it costs. Training by zones lets you spend the right amount of time at each intensity instead of guessing.
How do I compare to other cyclists?
The fairest comparison is by power-to-weight ratio within your age group and gender, since both age and sex affect sustainable power. Enter your FTP, weight, age, and gender in the calculator above to see your percentile against a filtered sample of TrainerRoad athletes. A percentile tells you the share of comparable riders you are stronger than, so the 70th percentile means your W/kg beats about 70 percent of cyclists in your group. Track the number across a training block to measure real progress rather than comparing yourself to riders in a different category.
How do I find my FTP?
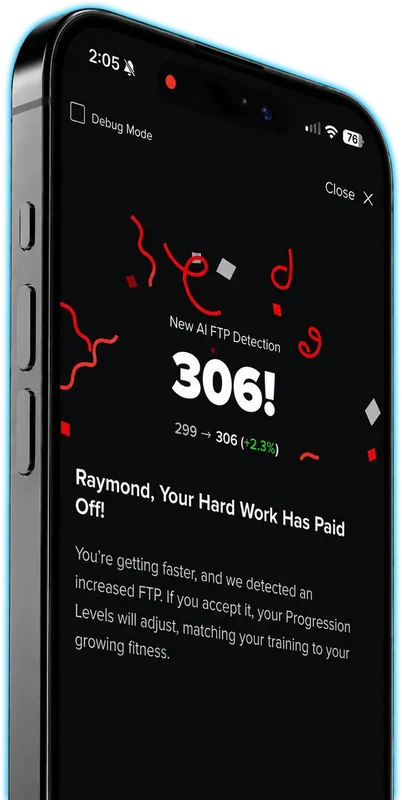
Traditionally, cyclists find their FTP with an occasional standardized test, like a ramp test or a 20-minute effort. Those tests can work, but they have real drawbacks: they do not always reflect an athlete's true ability, they require the skill to pace a hard effort and hold a steady power target, and they only capture a single snapshot of your fitness on one day, which often leads to sub-par training. TrainerRoad takes a different approach with AI FTP Detection. It estimates your FTP from your real ride and workout data, with no test to schedule or pace, and updates it regularly as your fitness changes so your training zones stay accurate. See the data behind AI FTP Detection.